Figure 5.
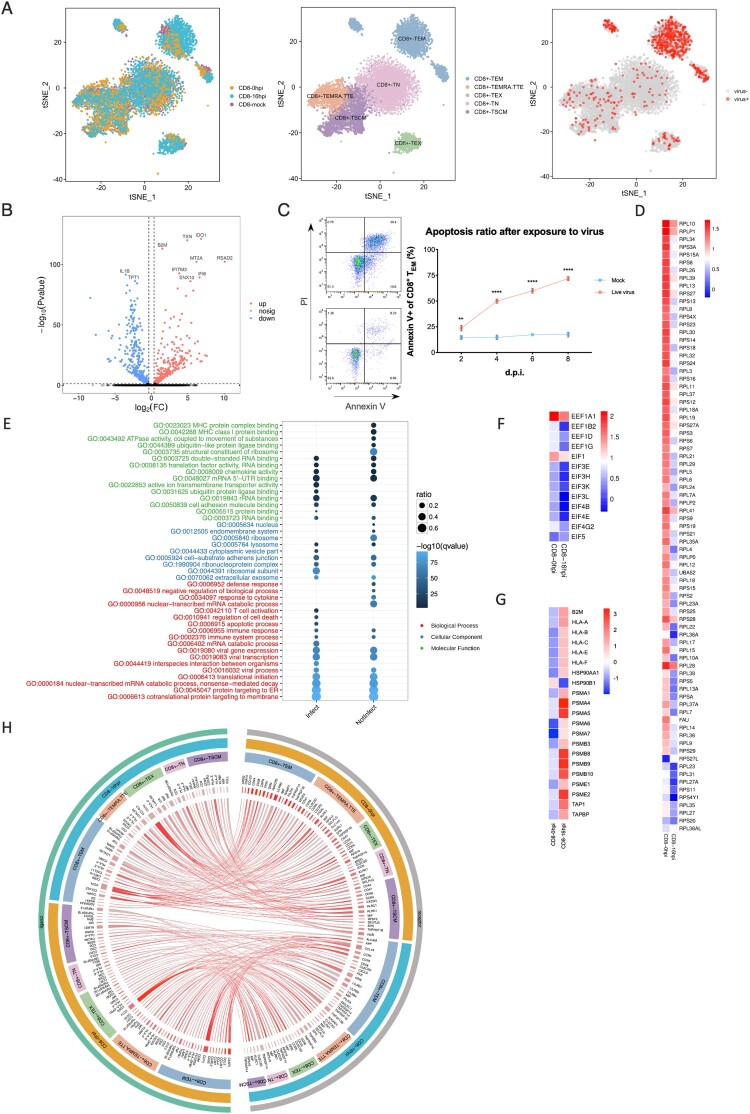
Biological consequences of non-productive infection in infected effector memory CD8+ T cells. (A) Left, subsets partition diagram of human CD8+ T cells through single-cell sequencing. Right, subpopulation distribution of infected CD8+ T cells (red) and bystander cells (grey). (B) Volcano plot of differentially expressed genes in infected CD8+ TEM over time. Red, up-regulation; blue, down-regulation. (C) Apoptosis of CD8+ TEM. Left, cells with annexin V and PI staining on 2 d.p.i. Right, apoptosis ratios of CD8+ TEM after exposed to H1N1 over time. Red represents for the group with treatment of live viruses while blue represents for the control group of UV-treated inactive viruses. Results are represented as mean fold change ± SD and statistical significances were analysed using GraphPad Prism 8.0 through two-tailed Student’s t-test. *p < 0.05, **p < 0.01, ***p < 0.001, ****p < 0.0001. (D) The heatmap of ribosomal protein-related genes in infected CD8+ TEM post-infection over time. (E) GO enrichment pathways change analysis of molecular function (green), cellular component (blue) and biological process (red) among infected and non-infected CD8+ TEM. (F) The gene change heatmap of eEFs in infected CD8+ TEM over time. (G) The gene change heatmap of MHC I-immunoproteasomes in infected CD8+ TEM over time. (H) Circos analysis of interactive relationships between membranous receptors and ligands among different CD8+ T subsets after exposed to H1N1 over time.

