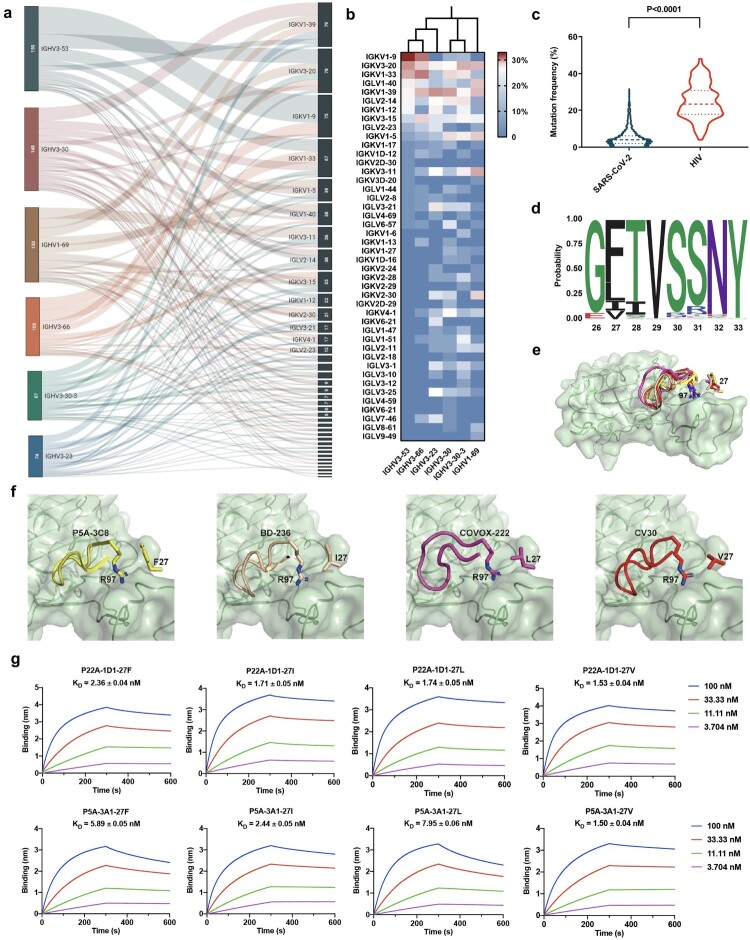
Figure 1.
Characteristic analysis of SARS-CoV-2-binding human monoclonal antibodies. (a) Sankey diagram showing the pairing information between the top 6 most used heavy chain genes and the corresponding light chain genes in SARS-CoV-2-binding antibodies. The number of antibodies originated from each gene is indicated in the left column. (b) Light chain pairing modes of the top 6 most used IGHV genes in SARS-CoV-2-binding antibodies as shown in the heatmap. The phylogenetic neighbor-joining tree among IGHV germline genes is displayed on the top of the heatmap. (c) Violin plot comparing somatic hypermutation rates of SARS-CoV-2- and HIV-binding antibodies. The numbers of antibodies included for the analysis were 1447 for SARS-CoV-2 and 237 for HIV. The quartiles are indicated by dashed lines. The p value was calculated by two-tailed Student’s t test. (d) Sequence logos for the CDR1 regions of 217 IGHV3-53/3-66-binding antibodies. The position of each residue is labelled on the x-axis based on IMGT numbering. The occurrence probability of each amino acid is labelled on the y-axis. (e-f) Interactions between CDR3 of four representative IGHV3-53/3-66-binding antibodies and SARS-CoV-2 RBD and zoom-in of P22A-1D1 (PDB entry 7CHS), BD-236 (PDB entry 7CHB), COVOX-222 (PDB entry 7NX6) and CV30 (PDB entry 6XE1). The RBD is deciphered as green ribbon and surface. Elements from P22A-1D1, BD-236, COVOX-222, and CV30 are coloured in yellow, brown, magenta, and red, respectively. CDR3 is presented as cartoon. R97 and residues on position 27 are presented as sticks. (g) Binding kinetics of mAb P22A-1D1, P5A-3A1 and their 27I, 27L and 27 V variants to SARS-CoV-2 RBD measured by BLI. The mean ± SD from three independent experiments are shown.

