. 2022 Apr 13;11:e75272. doi: 10.7554/eLife.75272

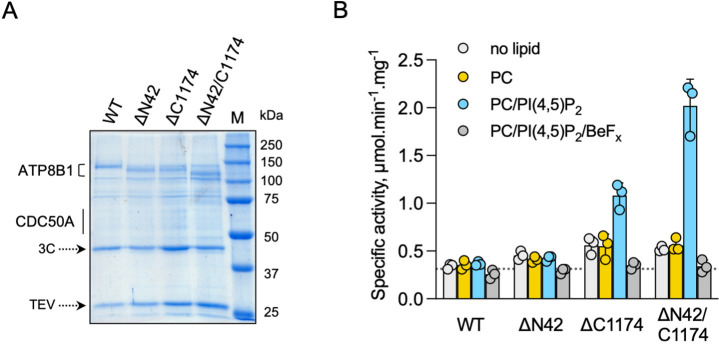
Figure 4. ATP8B1-CDC50A is autoinhibited by both its N- and C-terminal tails and the presence of lipids is required for its activity.

(A) Removal of N- and/or C-terminal extensions of ATP8B1 upon on-column cleavage of streptavidin-bound ATP8B1-CDC50A with both TEV and 3 C proteases assessed by Coomassie blue stained SDS-PAGE. ΔN42 lacks residues 1–42 of ATP8B1 whereas ΔC1174 lacks residues 1175–1251 and ΔN42/C1174 lacks both. M, molecular weight marker. Streptavidin-purified wild-type (WT) and truncated mutants were used for subsequent ATPase assays. (B) ATPase activity of wild-type (WT), N-terminally truncated (ΔN42), C-terminally truncated (ΔC1174) and both N- and C-terminally truncated (ΔN42/C1174) ATP8B1 ( ~ 5 µg ml–1 protein) in complex with CDC50A determined in DDM at 30 °C. The assay medium contained 1 mM MgATP, 0.5 mg ml–1 DDM, and 0.01 mg ml–1 CHS. PC and PI(4,5)P2 were added at 0.1 mg ml–1 (132 µM) and 0.025 mg ml–1 (23 µM), respectively, resulting in a DDM final concentration of 1.25 mg ml–1. The PC/PI(4,5)P2 ratio is therefore 5.8 (mol/mol) Data are a mean ± s.d. of three technical replicate experiments (purification #1, see Materials and methods). The dotted line represents background NADH oxidation due to photobleaching, measured in the absence of purified protein and lipids. Source files related to (B) are available in Figure 4—source data 1.

Figure 4—source data 1. GraphPad Prism tables for results displayed in Figure 4B.

Figure 4.

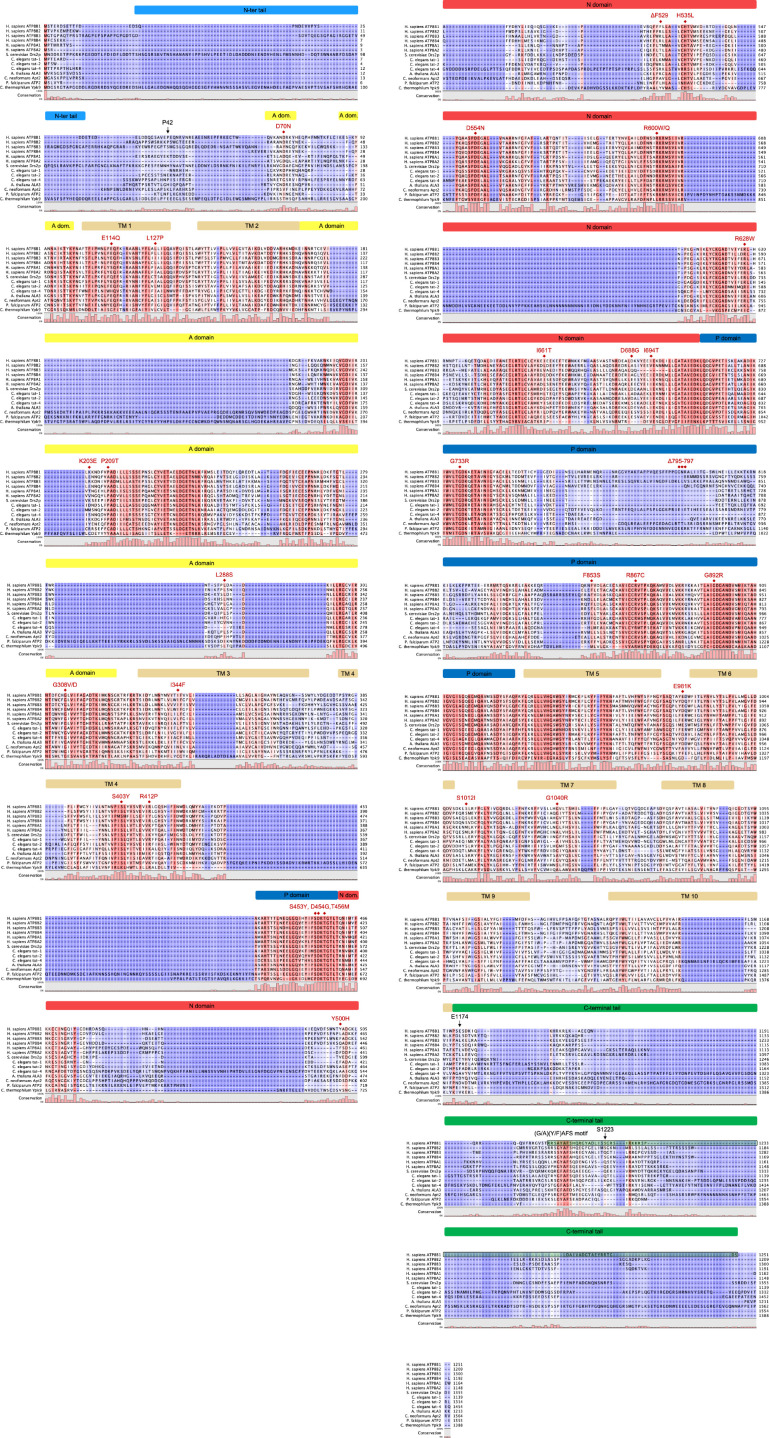
Figure 4—figure supplement 1. Sequence alignment of selected P4-ATPases.

Figure 4—figure supplement 1.

Sequences of the human ATP8B1, ATP8B2, ATP8B3, ATP8B4, ATP8A1, ATP8A2, the S. cerevisiae Drs2, the C. elegans tat-1, tat-2, tat-4, the A. thaliana ALA3, the C. neoformans Apt2, the P. falciparum ATP2 were aligned based on the presence of the conserved motif found on the regulatory C-terminus of ATP8B1, Drs2, ATP8A1 and ATP8A2. For comparison, the sequence of the C. thermophilum P5-ATPase Ypk9 is shown. Sequences were aligned using the ClustalW server and manually edited for the C-terminal region because of the very low conservation of this region (apart from the (G/A)(Y/F)AFS motif). The shading indicates conservation (blue 0% – red 100%). Mutations found in PFIC1, BRIC1, and ICP1 are indicated with red diamonds. The various cytosolic domains and transmembrane helices of ATP8B1 are indicated above the sequences. Residues P42 and E1174, after which 3 C protease cleavage sites were added, and the S1223 which is phosphorylated in mouse ATP8B1 are highlighted with arrows. The sequence used for the synthesis of the autoinhibitory C-terminal peptide is emphasized by a green box. Uniprot identifiers: ATP8B1 (O43520), ATP8B2 (P98198), ATP8B3 (O60423), ATP8B4 (Q8TF62), ATP8A1 (Q9Y2Q0), ATP8A2 (Q9NTI2),Drs2 (P39524), tat-1 (Q9U280), tat-2 (Q9TXV2), tat-4 (H2KZ37), ALA3 (Q9XIE6), Apt2 (Q5K6X2 ), PfATP2 (Q8I5L4), Ypk9 (G0S7G9).
Figure 4—figure supplement 2. The amount of CDC50A which co-elutes with ATP8B1 upon on-column cleavage with TEV and 3 C proteases is similar for wild-type ATP8B1 (WT) and the 3 C protease cleavage site insertion mutants (ΔN42, ΔC1174, ΔN42/C1174).
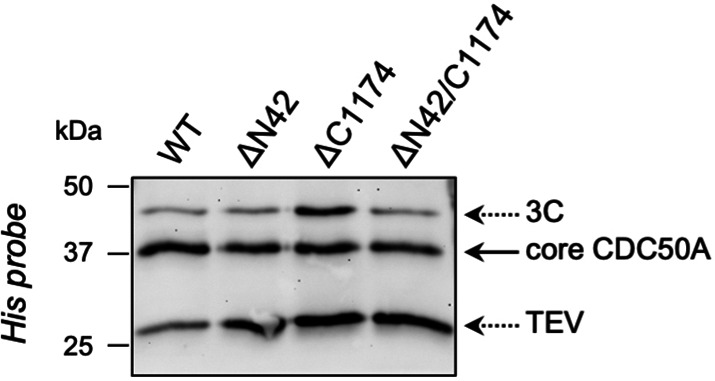
Figure 4—figure supplement 2.

The ATP8B1-CDC50A complex recovered from streptavidin beads upon proteolytic cleavage was denatured, treated with EndoH for 1 hr at 37 °C, and analyzed by immunoblotting with a Histidine probe.
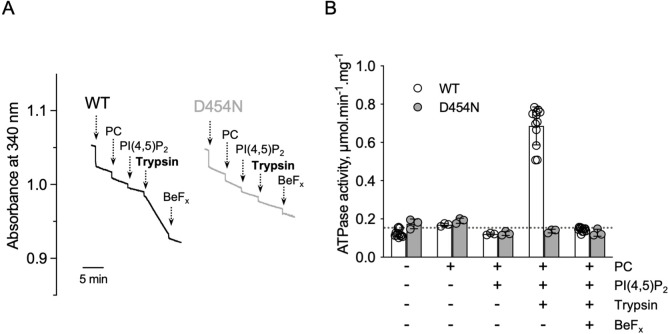
Figure 4—figure supplement 3. ATPase activity measurements of streptavidin-purified WT and catalytically-inactive D454N ATP8B1-CDC50A.

Figure 4—figure supplement 3.

(A) ATPase activity of the purified ATP8B1-CDC50A complex determined in DDM/CHS at 30 °C, using an enzyme-coupled assay, where the kinetics of NADH oxidation is monitored continuously. The various additions in the assay cuvette are indicated with arrows. ATP8B1 was added at ~2 µg ml–1 to continuously stirred cuvettes in an assay medium containing 1 mM MgATP, 0.5 mg ml–1 DDM, and 0.01 mg ml–1 CHS in buffer B. PC and PI(4,5)P2 were added at 0.1 mg ml–1 and 0.025 mg ml–1, respectively, resulting in a DDM final concentration of 1.25 mg ml–1. Trypsin and BeFx were added at 0.07 mg ml–1 and 1 mM, respectively. The rate of ATP hydrolysis corresponds to the slope measured after each addition. Activity is revealed upon addition of trypsin. (B) Specific ATPase activity of WT ATP8B1-CDC50A measured from traces such as that displayed in (A). The dotted line represents the background NADH oxidation level, as measured before addition of ATP8B1-CDC50A in the assay cuvette. Data in (B) are a mean ± s.d. of 6–12 replicate experiments. PC: phosphatidylcholine. Source files related to (B) are available in Figure 4—figure supplement 3—source data 1.
Figure 4—figure supplement 3—source data 1. GraphPad Prism tables for results displayed in Figure 4—figure supplement 3B.
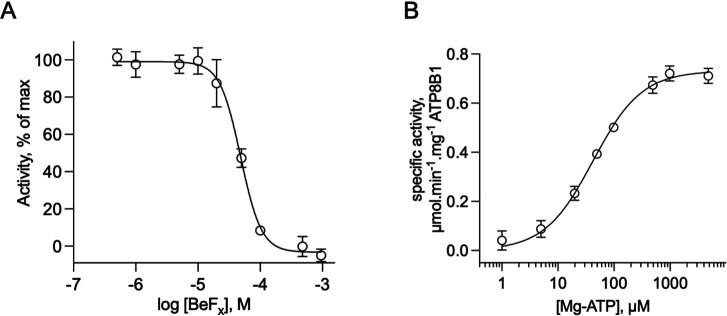
Figure 4—figure supplement 4. Catalytic properties of the purified ATP8B1-CDC50A complex.

Figure 4—figure supplement 4.

(A) Sensitivity to beryllium fluoride of ATP8B1 turnover rate. ATPase activity of ΔN42/C1174 ATP8B1 was measured at 30 °C in the presence of increasing concentrations of BeFx, with 2 mM DDM, 115 µM PC, 23 µM PI(4,5)P2, and ~0.5 µg ml–1 ΔN42/C1174 in the assay cuvette. Data are a mean ± s.d. of three replicate experiments. The activity in the absence of BeFx was taken as 100% and data were fitted to an inhibitory dose-response equation with variable slope. 95% confidence interval for IC50 value: CI[4.29 × 10⁻⁵, 5.43 × 10⁻⁵]. (B) Dependence on MgATP of the turnover rate. ATPase activity of ΔN42/C1174 ATP8B1 was measured at 30 °C in the presence of increasing concentrations of MgATP, with 2 mM DDM, 115 µM PC, 23 µM PI(4,5)P2, and ~0.5 µg ml–1 ΔN42/C1174 in the assay cuvette. Data are a mean ± s.d. of three replicate experiments. The data were fitted to a Michaelis-Menten equation. For panels (B) and (C), the rate of ATP hydrolysis was corrected for NADH photobleaching. Source files related to (A, B) are available in Figure 4—figure supplement 4—source data 1.
Figure 4—figure supplement 4—source data 1. GraphPad Prism tables and curve fitting for results displayed in Figure 4—figure supplement 4A, B.