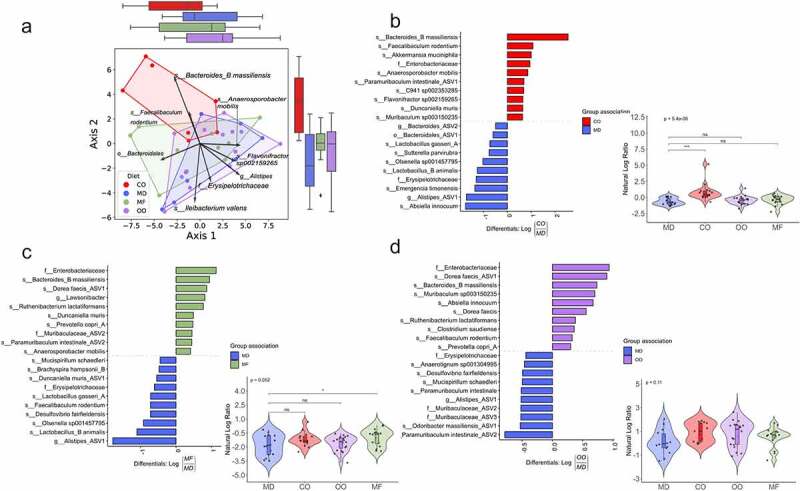
Figure 6.

The MD is associated with unique changes in the gut microbiota composition. Colon samples were collected post-diet intervention and sequenced for 16S rRNA at the V4-V5 region. (a) Principal component analysis biplot of robust centered-log ratio transformed distances. Circles represent individual mice, vectors represent ASV loadings, and the diet groups are enclosed with convex hull polygons. The ridge boxplots represent the principal component values along the corresponding axis. An overall significant difference between groups was assessed using a PERMANOVA test (p = 0.003, Pseudo F = 3.6, permutations = 999), and the assumptions of heterogeneous dispersion were checked using a PERMDISP test (p = 0.769, Pseudo-F =0 .77, permutations = 999). Pairwise post-hoc testing shows a significant difference between the CO and MD groups and CO to OO groups. (B to D) Ranked plots of the inverse additive log-ratio transform (inverse ALR) differentials from Songbird’s multinomial regression analysis, which estimates the probability of an ASV being observed for a specific diet group. The top and bottom 10 ranked ASVs are displayed as their highest classified taxonomic level based on the GTDB reference database. A positive value indicates a higher association with the numerator group. A negative value suggests a higher association with the denominator group. The MD is used as the reference group compared to CO, MF and OO diets (n = 7–14 mice per group). (See also Figure S7). ASV: amplicon sequence variant; GTDB: gene taxonomy database; PERMANOVA: permutational multivariate analysis of variance; PERMDISP: permutational analysis of multivariate dispersions.
