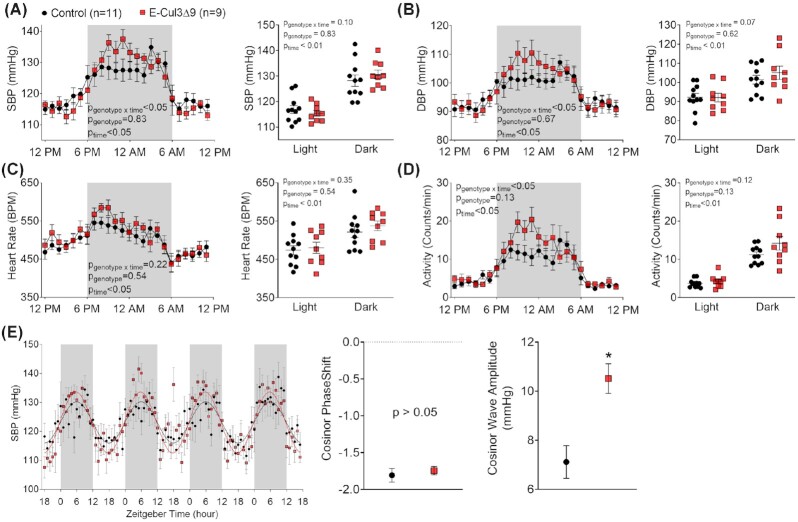
Figure 2.
Blood Pressure, Heart Rate, Activity, and Circadian Rhythm. Four weeks after completion of tamoxifen injections, BP and activity were measured by radiotelemetry for 10 min each hour for 7 consecutive days in male control and E-CUL3∆9 mice. (A) Systolic blood pressure (SBP), (B) diastolic blood pressure (DBP), (C) HR, and (D) activity data were collapsed onto a single 24 h light/dark cycle. The time course data were analyzed using 2-way ANOVA with repeated measurements to determine the effect of genotype, time, and interaction. Averages of the 12-hour light phase (6AM-5PM) and 12-h dark phase were shown in dot plots. Despite marked circadian variations in all parameters, no effect of genotype was detected (P > 0.05, two-way ANOVA). The p values for main effects of two-way ANOVA were indicated in each panel. (E) Cosinor analysis of continuous 96-h SBP data that represented the 7-d telemetry recordings. The mean and SEM of SBP amplitude and PhaseShift generated by the cosinor analysis was tested by Student's t-test. Shaded areas indicate the 12-h dark phase (6PM–5AM or Zeitgeber time 0–12). Data were plotted as mean ± SEM. n = 9–11/genotype. *, P < 0.05.

