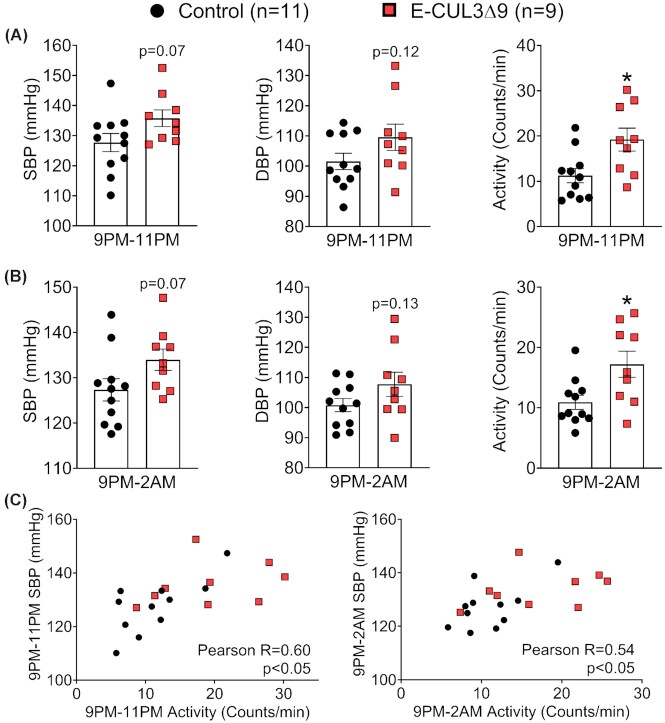
Figure 3.
Nighttime Blood Pressure and Activity. Four weeks after completion of tamoxifen injections, BP and activity were recorded by radiotelemetry for 10 min each hour for 7 consecutive days in male control and E-CUL3∆9 mice. (A) Averages of blood pressure and activity between 9PM–11PM and (B) 9PM–2AM plotted and analyzed by student's t-test. Data are plotted as mean ± SEM. *, P < 0.05, two tailed. (C) Averages of SBP and activity at 9PM–11PM (left) and 9PM–2AM (right) were plotted as XY coordinates for each mouse. Pearson correlation was performed. Number of XY pairs = 20 (11 for control and 9 for E-CUL3∆9). R, Pearson correlation coefficient.

