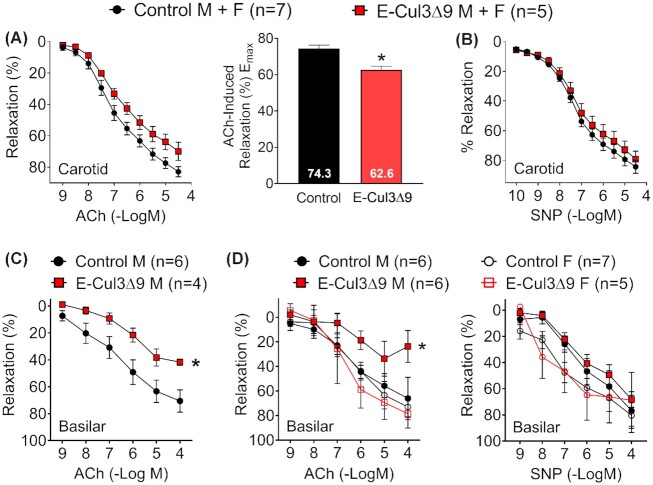
Figure 4.
Baseline Vasodilation. A-B) Isometric tension was initially measured with wire myography in the carotid artery of control and E-CUL3∆9 mice with equal sex ratio 4 wk after completion of tamoxifen. Vessel rings were equilibrated at a resting tension of 0.25 g for 45 min before pre-contracted to submaximal levels (40%–60%) with 60 nM U46619, a thromboxane A2 receptor agonist. (A) Cumulative concentration-response curves for acetylcholine (ACh) were plotted. Curves were first analyzed using two-way ANOVA with repeated measurements and results (pgenotype = 0.06, pconcentration < 0.01, pinteraction < 0.05) indicated that the effect of genotype on ACh response depends on its concentration. Emax for ACh responses were derived from non-linear regression and were analyzed by Student's t-test (two tailed). *, P < 0.05. (B) Cumulative concentration-response curves for sodium nitroprusside (SNP). No significant genotype effect was detected (P > 0.05). (C) ACh induced vasodilation was determined by pressure myography in the basilar artery in an initial cohort of male mice (Pgenotype < 0.05; pconcentration < 0.01, Pinteraction = 0.20). (D) In separate cohorts of male and female mice, ACh- and SNP-induced vasodilation was assessed by pressure myography in the basilar artery in both male and female mice (ACh: pgenotype = 0.06; pconcentration < 0.01, pinteraction = 0.26; SNP: pgenotype = 0.32; pconcentration < 0.01, pinteraction = 0.36). Two-way ANOVA with repeated measurements was performed for statistical analysis (C-D). *, p < 0.05, control M vs E-CUL3∆9 M at 10–4 mole/L ACh, Sidak's multiple comparison tests. Data are plotted as mean ± SEM. M, male; F, female. Sample sizes were indicated in each panel.

