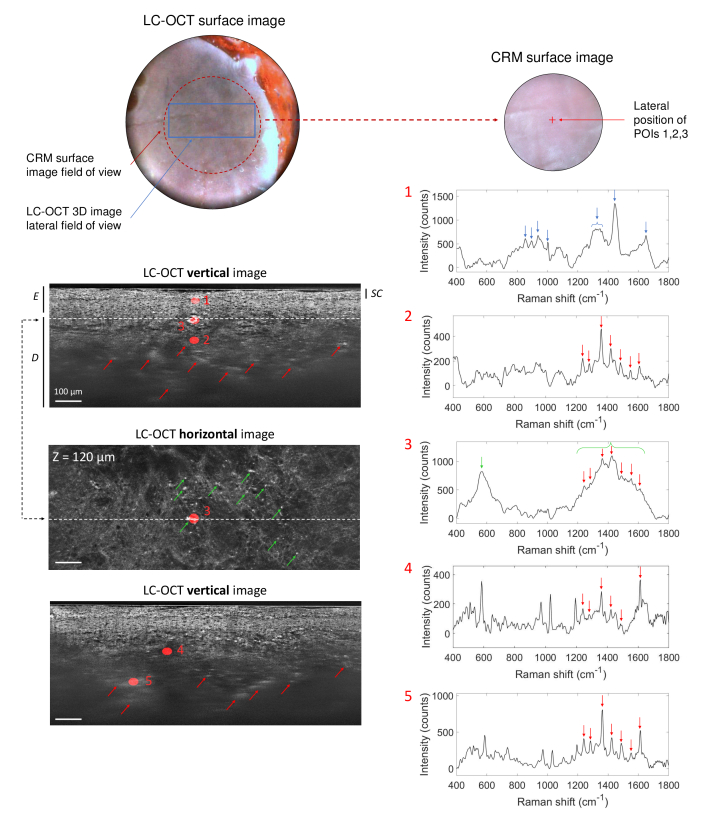
Fig. 7.
3D LC-OCT image (vertical and horizontal views) of a human biopsy taken within the red dye area of a multicolored tattoo, with associated Raman spectra obtained from CRM for five POIs identified in the 3D LC-OCT image and materialized by red ellipsoids. The dotted line on the horizontal image shows the position of the vertical image above regarding the horizontal plane of the 3D image, and vice-versa. The depth Z of the horizontal image is indicated with respect to the skin surface. The different superficial layers of the skin are visualized: the epidermis (E), including the stratum corneum (SC), and the dermis (D). On the LC-OCT images, red arrows point bright areas containing tattoo ink and green arrows show bright particles observed near the dermal-epidermal junction. On the Raman spectra, blue arrows depict Raman bands corresponding to the epidermis and red arrows show Raman peaks assigned to red ink. The green arrow and bracket represent the main Raman bands associated to bright particles observed near the dermal-epidermal junction in the 3D LC-OCT image. Surface images provided by the LC-OCT and CRM devices are also shown.

