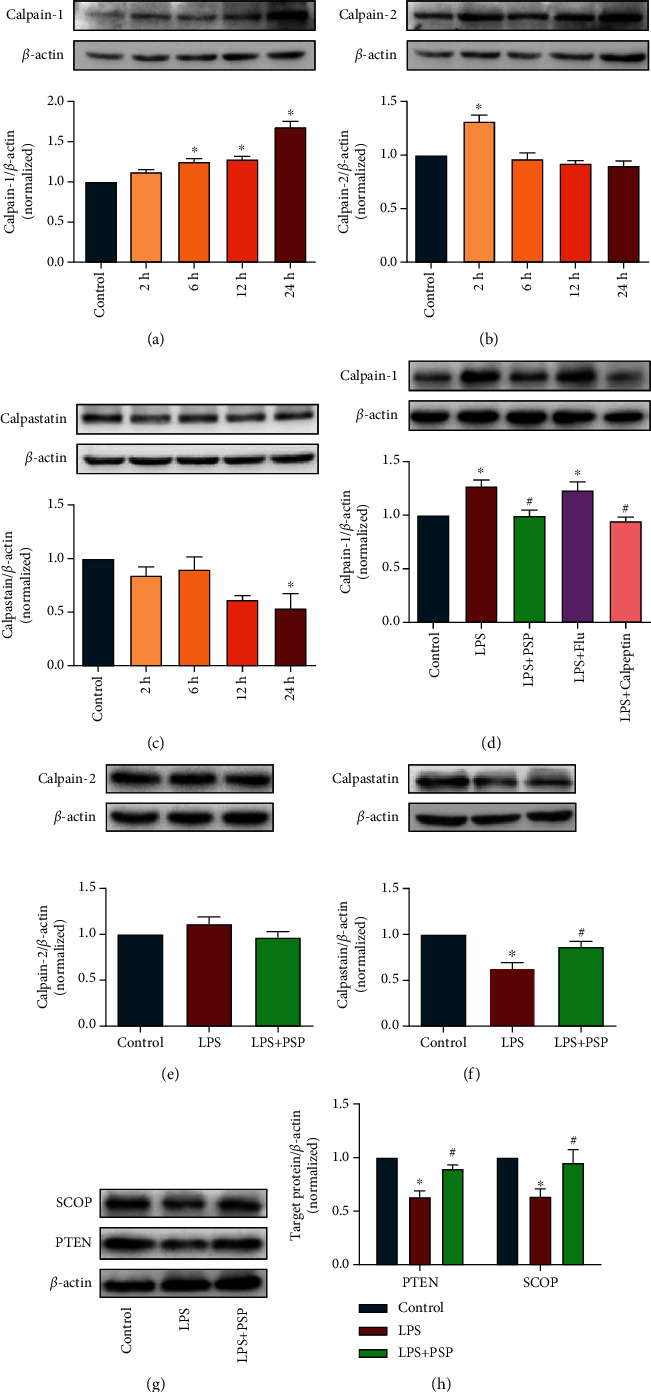
Figure 3.

PSP inhibited LPS-induced expression of calpain-1 and degradation of its substrates. (a–c) show the representative blots of calpain-1, calpain-2, calpastatin, and quantification data for calpain-1/β-actin, calpain-2/β-actin, and calpastatin/β-actin in experiment 1. (d–f) show representative blots of calpain-1, calpain-2, calpastatin, and quantification data for calpain-1/β-actin, calpain-2/β-actin, and calpastatin/β-actin. (g) shows representative blots of SCOP and PTEN. (h) shows the quantification data for SCOP/β-actin and PTEN/β-actin. Data are presented as the mean ± SEM. ∗P < 0.05 vs. control, #P < 0.05 vs. LPS group.
