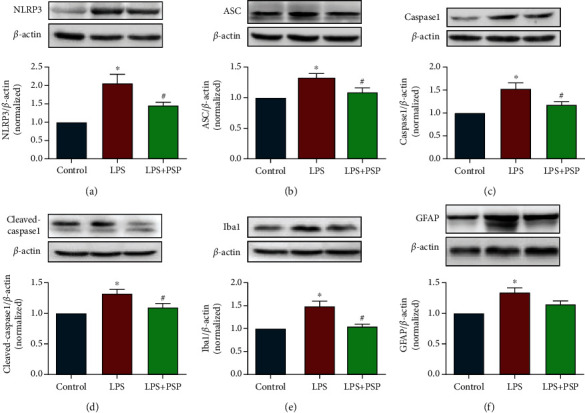
Figure 5.

PSP inhibited LPS-induced NLRP3 pathway activation and glial cell activation. (a–d) show representative blots of NLRP3, ASC, caspase-1, and cleaved-caspase-1 and quantification data for NLRP3/β-actin, ASC/β-actin, caspase-1/β-actin, and cleaved-caspase-1/β-actin. (e, f) show representative blots of Iba1 and GFAP and quantification data for Iba1/β-actin and GFAP/β-actin. Data are presented as the mean ± SEM. ∗P < 0.05 vs. control, #P < 0.05 vs. LPS group.
