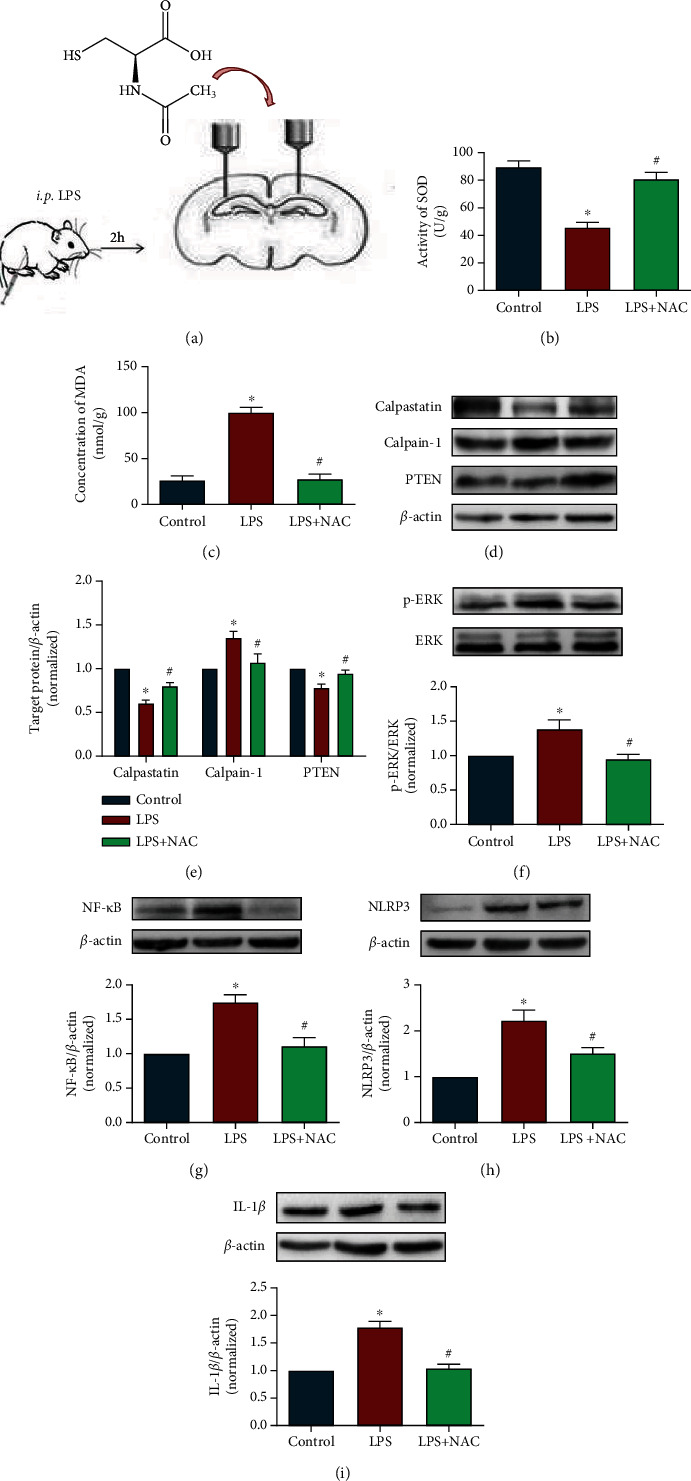
Figure 6.

NAC reduced oxidative stress levels and inhibited calpain-mediated inflammatory pathways. (a) shows the schematic design. (b, c) show SOD and MDA levels in the hippocampus. (d) shows representative blots of calpain-1, calpastatin, and PTEN. (e) shows quantification data for calpain-1/β-actin, calpastatin/β-actin, and PTEN/β-actin in experiment 3. (f–i) show representative blots of p-ERK, NF-κB, NLRP3, and IL-1β and quantification data for p-ERK/β-actin, NF-κB/β-actin, NLRP3/β-actin, and IL-1β/β-actin in experiment 3. Data are presented as the mean ± SEM. ∗P < 0.05 vs. control, #P < 0.05 vs. LPS group.
