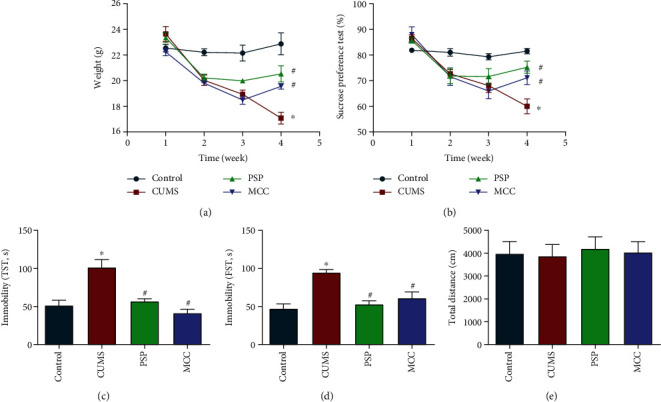
Figure 8.

PSP alleviated depression-like behavior in animals subjected to CUMS. (a) shows body weight. (b) shows sucrose preference index changes. (c, d) show the immobility times in the TST and FST. (e) shows the total distance travelled in the OFT. Data are presented as the mean ± SEM. ∗P < 0.05 vs. control, #P < 0.05 vs. CUMS group.
