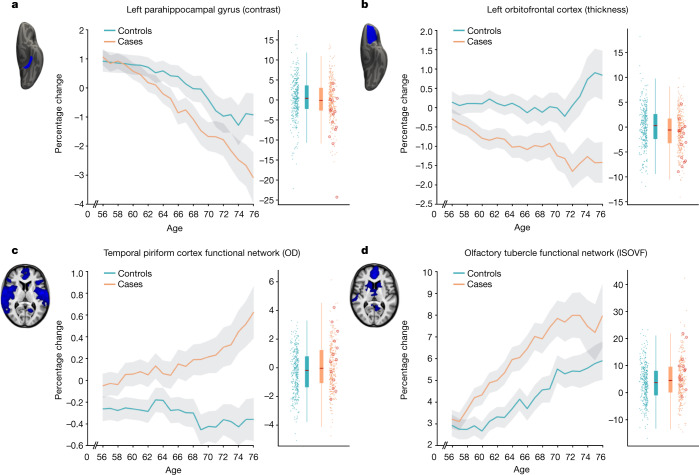
Fig. 1. The most significant longitudinal group comparison results from the hypothesis-driven approach.
a–d, The top four regions consistently showing longitudinal differences across the three models comparing SARS-CoV-2 cases and controls demonstrated either a significantly greater reduction in grey matter thickness and intensity contrast, or an increase in tissue damage (largest combined |Z| across Models 1–3). All three models pointed to the involvement of the parahippocampal gyrus (a), whereas Models 1 and 2 also showed the significant involvement of the left orbitofrontal cortex (b) and of the functional connections of the primary olfactory cortex (c, d). For each region, the IDP’s spatial region of interest is shown at the top left in blue, overlaid either on the FreeSurfer average inflated cortical surface, or the T1 template (left is shown on the right). For each IDP, the longitudinal percentage changes are shown with age for the two groups (control participants in blue, participants with infection in orange), obtained by normalising ΔIDP using the values for the corresponding IDPs across the 785 participants’ scans as the baseline. These are created using a 10-year sliding window average, with s.e.m. values shown in grey. The counter-intuitive increase in thickness in the orbitofrontal cortex in older controls has been previously consistently reported in studies of ageing57,58. The difference in cortical thickness, intensity contrast or diffusion indices between the two time points is shown for the 384 controls (blue) and 401 infected participants (orange), enabling a visual comparison between the two groups in a binary manner (therefore underestimating the effects estimated when modulating with age; see the ‘Main longitudinal model, deconfounding’ section in the Methods). The 15 hospitalised patients are indicated (red circles). ISOVF, isotropic volume fraction; OD, orientation dispersion. All y axes represent the percentage change.

