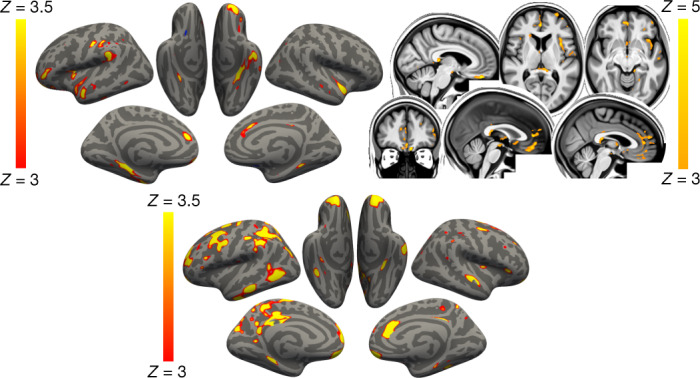
Fig. 2. Vertex-wise and voxel-wise longitudinal group differences in grey matter thickness and mean diffusivity changes.

Top, the main analysis (Model 1): the thresholded map (|Z| > 3) shows that the strongest, localised reductions in grey matter thickness in the 401 infected participants compared with the 384 controls are bilaterally in the parahippocampal gyrus, anterior cingulate cortex and temporal pole, as well as in the left orbitofrontal cortex, insula and supramarginal gyrus. Similarly, the strongest longitudinal differences in mean diffusivity (|Z| > 3, left is shown on the right) could be seen in the orbitofrontal cortex and anterior cingulate cortex, as well as in the left insula and amygdala (top). Bottom, secondary analysis (Model 4): the thresholded cortical thickness map (|Z| > 3) demonstrated longitudinal differences between the 15 hospitalised and 386 non-hospitalised SARS-CoV-2-positive cases in the orbitofrontal frontal cortex and parahippocampal gyrus bilaterally, right anterior cingulate cortex, as well as marked widespread differences in fronto-parietal and temporal areas, especially in the left hemisphere. We show the voxel-wise or vertex-wise longitudinal effects for illustrative purposes, avoiding any thresholding based on significance (as this would be statistically circular), similar to our previous analyses59.
