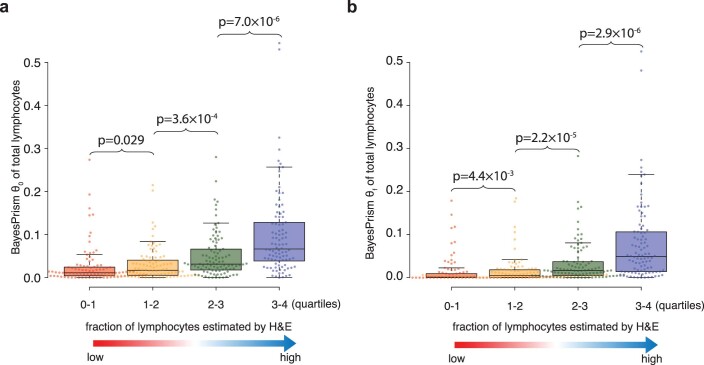
Extended Data Fig. 10. Comparison between the total lymphocyte fraction estimated by BayesPrism and H&E.
Box plots show the distribution of θ0 (a) and θf (b) of total lymphocytes computed by summing across CD4+ and CD8+ T cells B cells and NK cells. θ0 (a) and θf are binned by the quantiles of the fraction of H&E patches classified positive for tumor infiltrating lymphocytes (TIL). Boxes mark the 25th percentile (bottom of box), median (central bar), and 75th percentile (top of box). Whiskers represent extreme values within 1.5-fold of the inter quartile range. P values were calculated using the one-sided Wilcox test. 379 independent TCGA-SKCM patients with a unique single bulk RNA-seq sample and H&E data available were analyzed. Each bin contains n=95, 95, 95 and 94 samples respectively.

