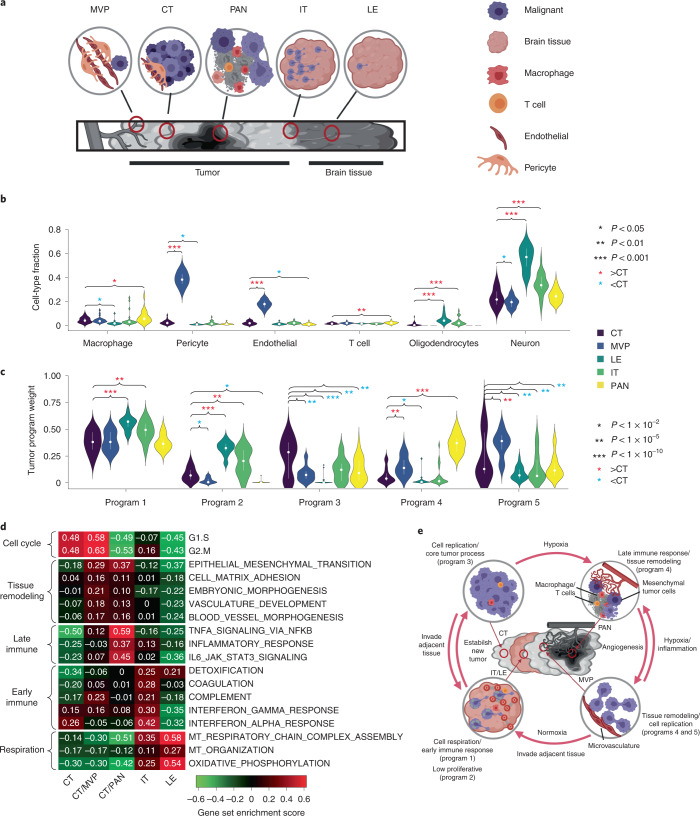
Fig. 5. BayesPrism reveals spatial heterogeneity in GBMs.
a, Cartoon depicting the spatial relationship between anatomic structures present in IVY GAP samples. b,c, Violin plots showing the distribution of cell type fractions (b) and weights of each gene program learned from TCGA-GBM (c) in the inferred expression of malignant cells of each anatomic structure over 122 IVY GAP samples. Median fractions are denoted by white dots and upper/lower quartiles by bars. Asterisks denote significant differences between CT and other anatomic structures, based on a linear mixed model. P values were computed by two-sided t-test using a linear mixed model without correction for multiple testing. Values of test statistics are given in Source data. d, Heatmap showing gene set enrichment score of each anatomic structure for biological processes selected from the correlation analysis shown in Fig. 3d and Supplementary Fig. 4a. e, Model depicting interaction between gene programs in malignant and nonmalignant cells in the GBM microenvironment.

