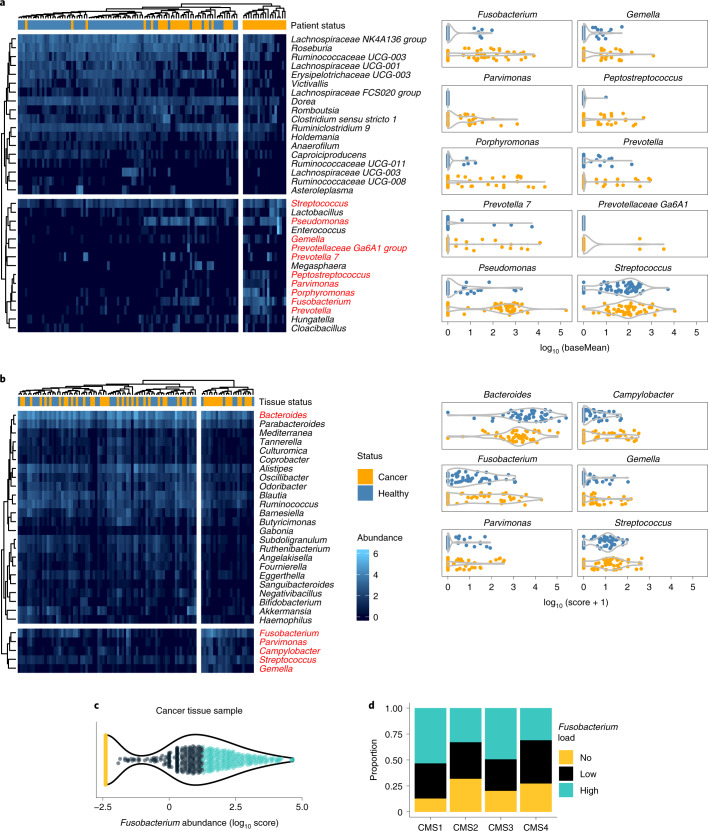
Fig. 1. Fusobacterium levels are elevated in stool and tissue from patients with CRC and are associated with CMS1 and metabolic-driven CMS3.
a, Differential abundance of bacterial genera in CRC stool samples. Clustered heatmap (Pearson correlation) shows the significant differentially abundant bacterial genera in an in-house cohort of samples from patients with CRC (n = 52 independent biological samples) in comparison with healthy donor (n = 63 independent biological samples) (P < 0.05; negative binomial Wald Benjamini–Hochberg testing) as identified by 16S rRNA gene sequencing. Top CRC-enriched bacteria7 are marked in red and separately plotted as abundance (baseMean) of a bacterium per patient (right). Heatmap intensities (blue colour scale) represent log10 base mean values. b, Differential abundance of bacterial genera in CRC-tissue samples, following a PathSeq analysis on whole-exome sequencing (WXS) data (TCGA). Clustered heatmap (Pearson correlation) showing the significant differentially abundant bacterial genera in tumour tissue samples from patients with CRC (n = 50) in comparison with adjacent healthy mucosal samples (n = 50, P < 0.05; negative binomial Wald Benjamini–Hochberg testing). Top CRC-enriched bacteria are marked in red and separately plotted as abundance (score) of a bacterium per sample (right). Heatmap intensities (blue colour scale) represent log10 scores. c, Fusobacterium abundance in tissue samples from patients with CRC (n = 595 independent biological samples, TCGA). WXS data were analysed for the logarithmic score abundance of Fusobacterium across all samples via quantile-based classification (colour code). d, Fusobacterium abundance across CMS subtypes. The cohort (c) was subjected to gene expression analysis and CMS classification of matching RNA-seq67. Coloured, segregated bars show the proportion of patients with fusobacterial loads per CMS. Significant differences were observed for CMS1 versus CMS2 (P = 0.003103733) or CMS4 (P = 0.006062911) and CMS3 versus CMS2 (P = 0.038151361) or CMS4 (P = 0.035902419) Chi-squared tests. nCMS1 = 62, nCMS2 = 207, nCMS3 = 69, nCMS4 = 139 biologically independent samples.

