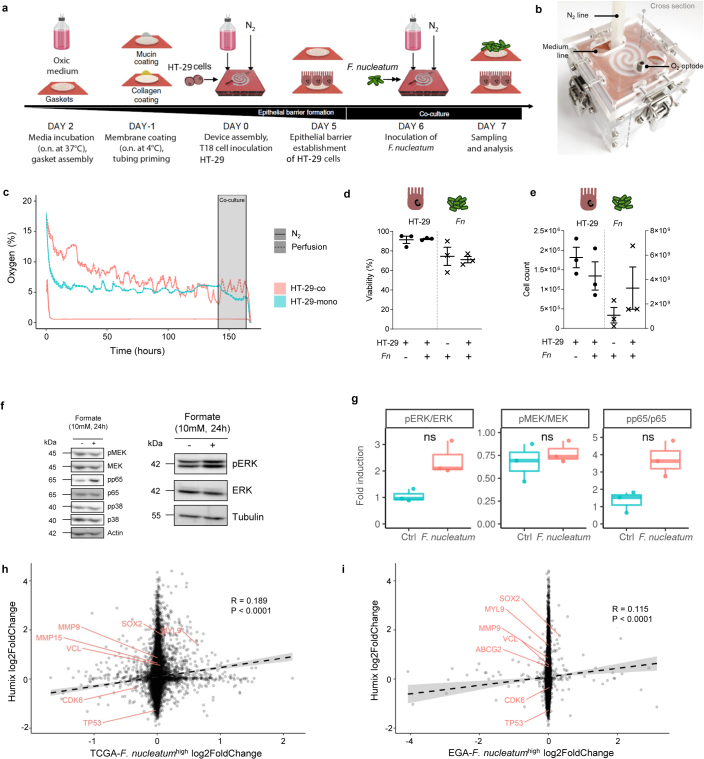
Extended Data Fig. 2. Microbiome cross-talk studies in HuMiX.
a, Experiment layout of HuMiX experiments. Devices assembly and medium priming for 1 day; epithelial cell inoculation and monolayer formation for 6 days; bacterial-human coculture for 24h. Control devices with either bacterial or human cell mono-cultures were run in parallel. At the endpoint, devices were opened for chamber metabolite sampling and cell harvesting. b, Clamped HuMiX device, showing the HuMiX device (spiral), the N2 and medium lines as well as free optode pockets (cf. Figure 2A). c, Oxygen levels (%) as monitored in the perfusion and N2 gas microchambers of HuMiX HT-29 mono-/ and cocultures. The grey box marks the the co-culture time. d, Fn and HT-29 cell viability in HuMiX mono-/ and co-cultures. Human cell viability was assessed by TrypanBlue staining and FACS-based L/D NearIR staining. Bacterial cell viability was assessed by BacLight L/D staining under a microscope. Three representative images were taken and cell viability was assessed with ImageJ. (c), (d) and (e) show data from n=three biologically independent experiments. e, Cell counts of human cells and bacteria under co-culture. Cell counts of HT-29 cells were taken after TrypanBlue staining. Bacteria cell counts were assessed using CASY cell counter with the 45µm capillary. f, Western Blot detection of MAPK signaling, as well as NF-κB signaling on HuMiX HT-29 cell lysates. phosphorylation of MEK at Ser217/221, p65 at Ser536, pERK at thr 202/tyr204, and p38 at thr180/tyr182 under HT-29 monoculture (-) and HT-29-Fn co-culture (+) conditions in HT-29 cells. Data shows one representative of three biologically independent experiments. g, Quantified ratios of phosphorylated protein per total target protein levels from (f), n=three biologically independent experiments. All boxplots show medians with 1st and 3rd quantiles. The whiskers from the hinges to the smallest/largest values represent 1.5*inter-quartile range (IQR). ns=not significant; two-sided paired t-tests. h-i, Correlation of global transcriptomic profile of HuMiX co-cultures with Fusobacteriumhigh vs. no patient’s gene expression profile of the TCGA (h) and EGA (i) datasets. Interesting gene targets are marked in red. Two-tailed Spearman’s rho correlation testing was used to assess significance between the two data sets.

