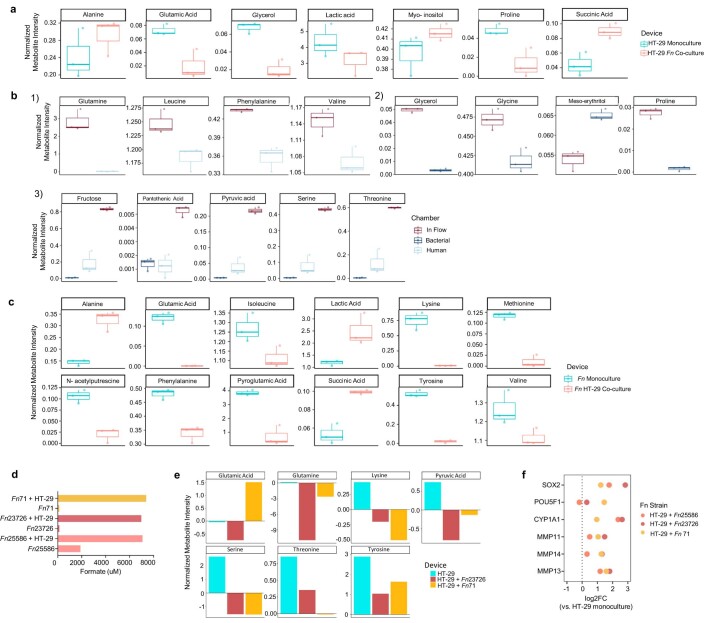
Extended Data Fig. 3. Metabolome composition in HuMiX microbiome-host crosstalk.
a, Significant differentially abundant metabolites in HT-29 mono-/ vs. HT-29-co-cultures, human cell microchamber supernatants. b, Significant differentially abundant metabolites in (1) HT-29-co-cultures comparing inflow metabolite levels with human chamber metabolite levels, (2) Fn-co-cultures, comparing inflow metabolite levels with bacterial microchamber supernatants. (3), HT-29-co-cultures and Fn-co-cultures, comparing inflow metabolite levels with human and bacterial microchamber supernatants. These were ambiguous metabolites that could not be assigned to any of the two cell types as being produced or secreted. c, Significant differentially abundant metabolites in Fn mono-/ vs. Fn-co-cultures, bacteria microchamber supernatants. a, b and c show data from n=three biologically independent experiments. All boxplots (in a, b and c) show normalized median metabolite levels (log intensities). Boxplots show medians with 1st and 3rd quantiles. The whiskers from the hinges to the smallest/largest values represent 1.5*inter-quartile range (IQR). p<0.05 for a, b, and c; unpaired, two-sided t-test. d, Levels of formate in different Fn isolates (Fusobacterium nucleatum 23726 and Fusobacterium nucleatum ssp. animalis 7_1, clinical isolate, one chamber per isolate) in monoculture and co-cultures with T 18 cells in HuMiX. e, Levels of metabolites in HuMiX in HT-29 cells alone or in co-culture with different Fn isolates (Fusobacterium nucleatum 23726 and Fusobacterium nucleatum ssp. animalis 7_1, clinical isolate, one chamber per isolate). f, Genes related to AhR signaling and cancer stemness in HT-29 cells after co-culture with different Fn isolates in HuMiX.

