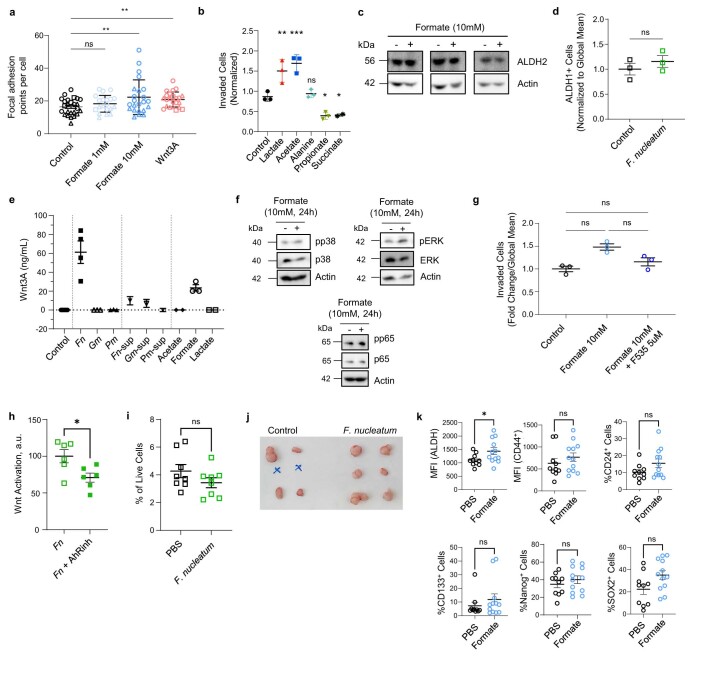
Extended Data Fig. 5. Fusobacterium nucleatum and formate induced pathways.
a, Focal adhesion formation in HT-29 cells after formate or rhWnt3A (100ng/mL) exposure for two days. Data shows technical replicates with at least 100 cells per condition from three independent experiments (different shapes), p=0.0029240 and p=0.0024919 for formate 10mM and Wnt3A vs. control respectively, two-tailed nested ANOVA, with Tukey multiple comparison of means. b, Transwell invasion of HCT116 CRC cells after treatment with lactate (positive control), acetate, propionate (10mM), alanine and succinate (5mM), n=three biologically independent experiments, each with three technical replicates, ns=not significant, p=0.0030, p=0.0004, p=0.0217, p=0.0479 for lactate, acetate, propionate and succinate vs. control respectively, ordinary one-way ANOVA Dunnett testing. c, Protein levels of ALDH2 in formate-treated (+) and untreated (-) cells. d, ALDH activity in human colonic organoids after treatment with Fn. Data shows mean±SEM of n=three biologically independent experiments (ns=not significant). e, Wnt activity in 7TGO-RKO Wnt-reporter cells stimulated with bacteria Fn, Gemella morbillorum (Gm) and Parvimonas micra (Pm)) or with 10% [v/v] cell-free bacterial culture supernatants (-sup) or with bacterial secretion products (10mM) for 1h. Bars represent mean±SD of n=one (bacterial supernatants), two (lactate, acetate), three (Gm, Pm, formate, Wnt), four (Fn) or six (control) biological replicates. f, Protein levels of pERK/ERK, pp65/p65 and pp38/p38 in formate treated (+) and untreated (-) cells. g, Transwell invasion of HCT116 CRC cells after 48 hours of stimulation with formate alone or in presence of a Wnt-signaling inhibitor (F535). Data shows mean±SEM of n=three biologically independent experiments. Control and formate condition alone are also shown in Fig. 4b. ns=not significant, repeated measures one-way ANOVA. h, Wnt activity in Fn-supernatant treated 7TGP-RKO Wnt-reporter cells alone or with an AhR inhibitor. Data shows mean±SEM of two biologically independent experiments, p=0.0228. i, Stemness marker CD44 in mouse tumours after intratumoral injection of Fn. Data shows mean±SEM percentage of CD44+ live cells (ns=not significant), n=8 independently treated tumors. j, Photograph of explanted subcutaneous xenografts from secondary recipient mice from Fig. 5f. k, Expression of stemness markers in formate-injected and control tumors, n=10 and n=12 independently treated tumors for the control and formate conditions respectively. Data shows mean±SEM for mean fluorescence intensity (MFI) of ALDH and CD44 and percentage of CD24, CD133, Nanog and Sox2, expressing cells. (ns=not significant, p=0.0460 for ALDH); unpaired, two-sided t-test in (d), (i), (j), and (l). *p<0.05, **p<0.01, ***p<0.001.

