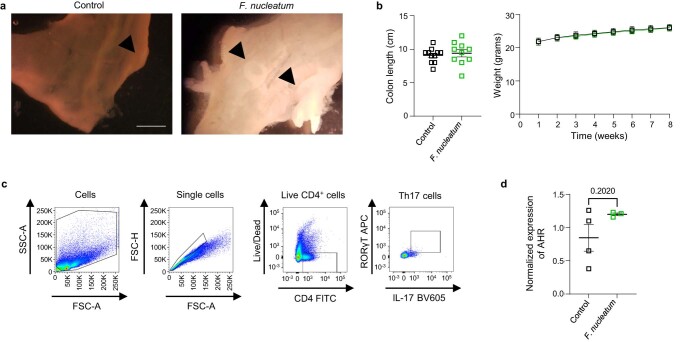
Extended Data Fig. 6. Fusobacterium nucleatum and formate induced pathways.
a, Representative images of open colons of PBS or Fn treated mice. Black arrows mark tumors, scalebar=5mm. b, Colon length in centimeters (measured upon resection, left) and mouse body weight over time in grams (right) of germ-free mice gavaged with Fn and control mice. Data shows mean±SEM, n=11 and n=10 biologically individual animals for the control and Fn-treated groups respectively, pooled from two independent experiments. c, Representative gating strategy of Th17 cells. Th17 cell gating was performed on live (APC-Cy7-) single cells with FITC(CD4)+, BV605(IL-17)+ and APC(RORγT)+ staining. d, Gene expression levels of AHR as assessed by RT qPCR in Fn-gavaged mice. Data shows mean±SEM of n=4 biological replicates in control and n=3 biological replicates in Fn, two-sided t-test.

