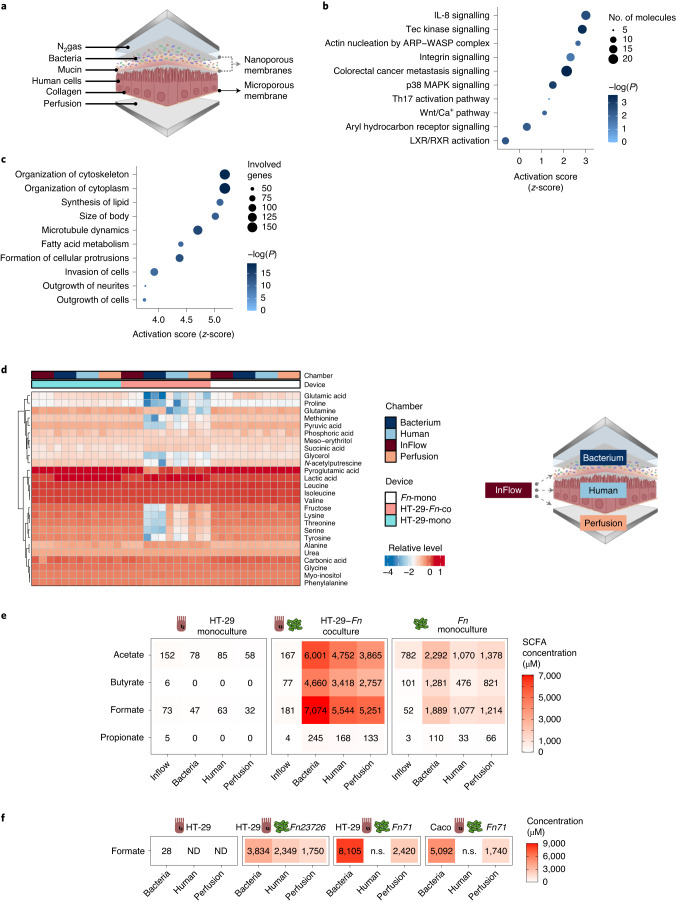
Fig. 2. Gut-on-chip cocultures (HuMiX) of Fn with patient-derived primary CRC cells reveal protumorigenic and pro-invasive effects along with an altered metabolic profile.
a, Schematic representation of the HuMiX setup. b, IPA canonical pathway analysis of HuMiX HT-29 co- versus monoculture differential gene expression analysis. Plot shows z-scores, -log(P) values and the number of molecules per pathway. Selected significant pathways are shown (P < 0.05), Fisher’s Exact Test. c, IPA Diseases or Functions analysis of HuMiX HT-29 co- versus monoculture differential gene expression analysis. Plot shows z-scores, P values, and the number of genes per pathway. Top ten significant pathways are shown (P < 0.05): Fisher’s exact test. d, Exometabolite profile of HuMiX cocultures. Untargeted GC–MS metabolite detection in chamber supernatants was used to measure relative, normalized metabolite levels. Heatmap shows relative log intensities of extracellular metabolites (rows) accross n = three independent experiments, each with one device per condition (main columns) composed of four chambers (subcolumns). e, SCFA levels in the HuMiX after HT-29-Fn coculture. Heatmap shows mean concentrations of extracellular SCFAs (rows) from n = 3 independent experiments, each with one HuMiX device per condition, composed of four chambers (columns). f, Levels of formate in the HuMiX chambers using different Fn isolates (Fn 23726 and one clinical isolate Fn ssp. animalis 7_1) in coculture with HT-29 or Caco-2 cells (n = 1 experiment with one HuMiX device per condition). ND, not detected and n.s., not sampled.

