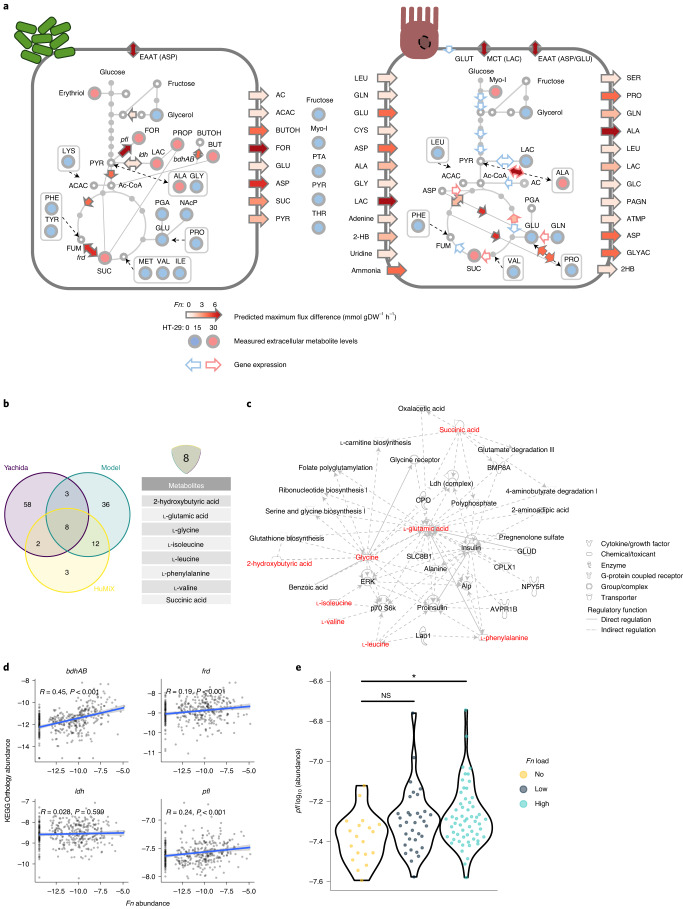
Fig. 3. In silico modelling delineates enhanced formate metabolism of Fn in CRC context, which is also observed in Fusobacterium-high patients with CRC.
a, Metabolic models of the central carbon metabolism of Fn (left) and HT-29 cells (right) in coculture versus monocultures. Biomass production was 0.20476 for Fn and 0.01 for HT-29. Flux constraints were set according to the metabolite secretion profiles of the HuMiX monoculture controls and pairwise interactions were calculated via FVA. Heatmap arrows show maximum flux changes (mmol dGW−1 h−1) of depicted reactions as predicted by FVA. Arrows at the cells’ boundaries represent intra-extracellular exchange reactions. Measured differentially abundant exometabolites in the respective HuMiX coculture chambers are shown as filled circles (blue, decreased; red, increased). Extracellular filled circles show unassigned metabolites. Coloured arrow borders show upregulated (red) or downregulated (blue) genes involved in the respective reaction fluxes, on the basis of RNA-seq data (refer to Fig. 2b). Dashed arrows show indirect connections between nodes. 2HB, 2-hydroxybutyrate; AC, acetate; ACAC, acetoacetate; ATMP, adenylthiomethyl-pentose; BUTOH, butanol; EAAT, excitatory amino acid transporters; GLYAC, glyceric acid; LAC, lactate; MCT, monocarboxylate transporters; NAcP, n-acetylputrescine; PAGN, phenylacetylglutamine; PGA, pyruglutamic acid; and bdhAB, butanol dehydrogenase. b, Core set of Fn-related metabolites. Venn diagram shows overlapping, differentially abundant metabolites in the Yachida dataset (purple), in HuMiX (yellow) and in the metabolic model (green). c, IPA network analysis of the gene-regulatory role of Fn core metabolites (red) in connection with host gene-regulatory nodes of stemness and invasion. d, KEGG orthology gene abundances of Fn-related genes identified by the model in patients with CRC with different fusobacterial load in stool samples. Two-tailed Spearman’s rho correlation testing was used. e, pfl in stool metagenomes of stage I/ II, Fnhigh patients with CRC. nFn-no = 19, nFn-low = 34, nFn-high = 58 (NS, not significant, P = 0.0219 for Fn-no versus Fn-high; one-way analysis of variance (ANOVA) with Tukey’s honestly significant differences test). *P < 0.05.

