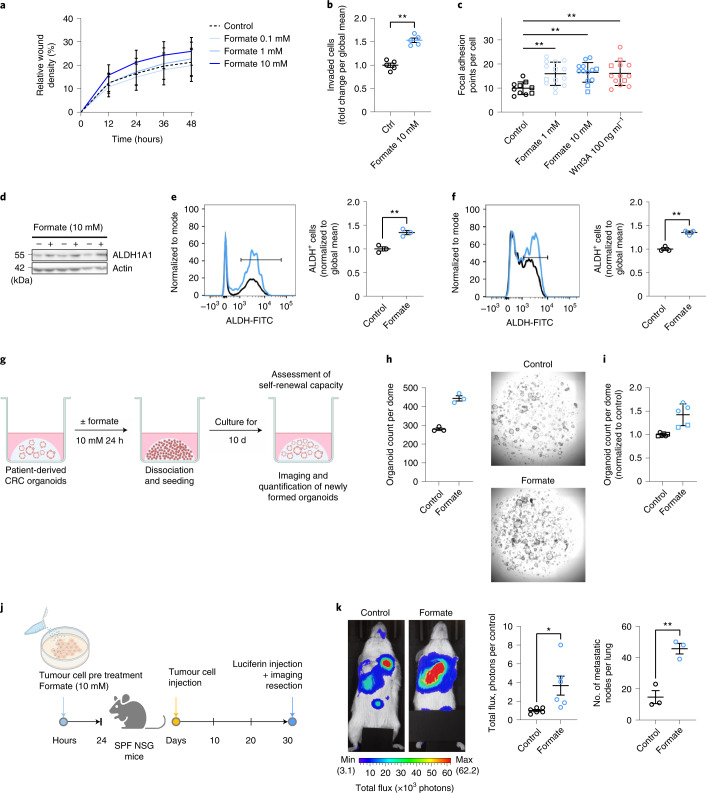
Fig. 4. Formate drives CRC cell invasion by increasing cancer stemness.
a, Scratch wound healing capacity of HCT116 CRC cells over 48 h, n = 3 biologically independent experiments. Gut formate physiological dose is considered to be near 10mM. b, Transwell invasion of HCT116 CRC cells at 48 h. Data show the means of replicates from n = 5 independent experiments, P = 0.0079, two-tailed Mann–Whitney test. c, Focal adhesion formation in HCT116 CRC cells after formate or rhWnt3A exposure for 24 h, Data show means of technical replicates with at least 100 cells per condition from two independent experiments (indicated by different shapes). P = 0.0150, P = 0.0037 and P = 0.0067 for formate 1 mM, formate 10 mM and rhWnt3A versus control, respectively, ordinary two-way ANOVA with Tukey’s multiple comparisons test. d, ALDH1A1 protein levels in formate (+) treated versus untreated (−) HT-29 cells. e,f, ALDH activity in human (e) or APCmin mouse colonic organoids (f) after formate stimulation (5 mM, 24 h; FACS). Left, representative histogram of the ALDH+ cell population (crossbar). Right, quantification of ALDH activity, n = 3 independent experiments. P = 0.0053 in e and P = 0.0129 in f, unpaired two-tailed t-test. FITC, fluorescein isothiocyanate. g, Schematic representation of experimental setup. Derived control or formate-treated organoids from a CRC patient were dissociated and reseeded at 24 h. h, The organoid formation capacity on day 10 after reseeding. Left, the number of organoids counted in one representative experiment out of two, with three technical replicates, Right, representative images of one well per condition, i, Normalized organoid formation, n = 2 biologically independent experiments (different data point shapes) with two or three technical replicates per condition. j, Schematic overview of the intravenous metastatic dissemination model. HT-29-Luc tumour cells were treated with formate before intravenous injection into NSG mice (1 × 10⁶ cells per 200 µl per injection). k, IVIS imaging after luciferin injection on day 30 after tumour cell injection. Left, representative images from one mouse per group. Middle, the quantified tumour cell signal from lungs. Data show the total luciferase signal (reported as photon flux per mg of tissue), normalized to control, n = 6 biologically independent animals per condition, pooled from two independent experiments. Right, the number of lung macroscopic metastatic nodes, n = 3 biologically independent animals per condition from one representative experiment out of two. P = 0.0257 and P = 0.0045 in the middle and right panels, respectively, unpaired two-tailed t-test. b, c, e, f and k are shown as mean ± s.e.m. *P < 0.05, **P < 0.01.

