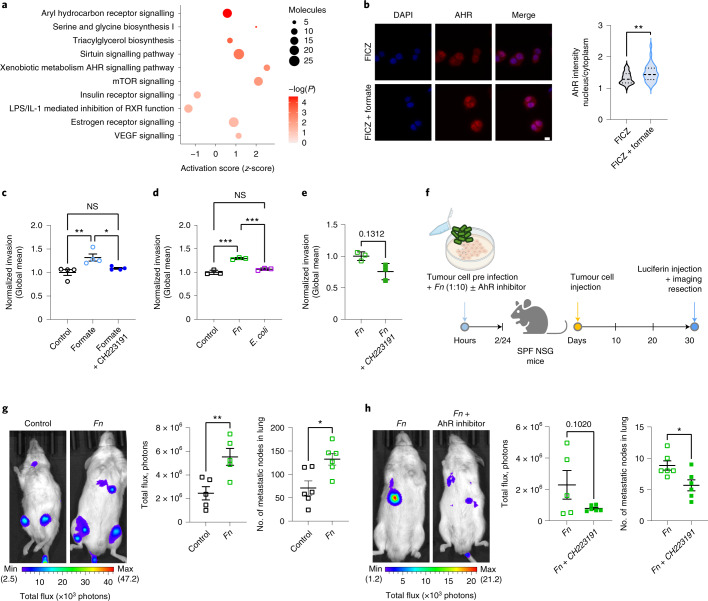
Fig. 5. Microbiome-derived formate drives metastatic dissemination through the activation of the AhR signalling pathway.
a, IPA analysis of differentially expressed genes in formate (10 mM) versus PBS treated HT-29 cells. Plot shows z-scores, P values and the number of molecules per selected significant pathway (−log(P) > 1.3), Fisher’s Exact Test. b, AhR nuclear translocation in HT-29 cells treated with FICZ (known AhR ligand, 100 nM) alone or combination with formate (10 mM) for 6 h. Data shows technical replicates from two independent experiments, P = 0.00113, two-tailed nested ANOVA. Dashed lines represent the medians and dotted lines represent the upper and lower quartiles. c, Transwell invasion of HCT116 CRC cells after formate stimulation (10 mM, 48 h) alone, or in presence of an AhR signalling inhibitor (CH223191, 0.5 µM); P = 0.0417 for formate versus control; ordinary one-way ANOVA. d, Transwell invasion of HCT116 CRC cells after Fn and Escherichia coli coculture (MOI 10, 2 h). ***P < 0.001; ordinary one-way ANOVA. e, Transwell invasion of HCT116 cells upon Fn preinfection alone or in presence of an AhR signalling inhibitor (CH223191, 0.5 µM) for 24 h: paired two-sided t-test. c–e, Data show pooled means of replicates from three (d and e) or four (c) independent experiments. f, Schematic representation of experimental setup of g and h: NSG mice were intravenously injected with 1 × 10⁶ cells per 200 µl (g) or 0.5 × 10⁶ cells per 200 µl (h) HT-29-Luc cells, preinfected with Fn (MOI 10) for 2 h and pretreated with (h) or without (g) AhR inhibitor for 24 h (CH223191, 0.5 µM). After 30 d, signals of HT-29-Luc cells were determined using the IVIS. g,h, Left, representative image of one mouse per group. Middle, data show the total luciferase signal (reported as photon flux per mg of tissue) normalized to control. Right, the number of lung macroscopic metastatic nodes, n = 6 biologically independent animals per condition in g and h, excluding (g) (middle), where n = 5 biologically independent animals per condition (one mouse failed luciferin intraperitoneal injection). Regions of interest in g: control, 1–11.001 × 10⁶ and Fn, 2–3.379 × 10⁶. P = 0.0094, P = 0.0110 and P = 0.0210 in g (middle and right) and h (right), respectively, unpaired two-tailed t-test. Total flux was measured in the chest area. Data in c–e, g and h are represented as mean ± s.e.m. *P < 0.05, **P < 0.01, ***P < 0.001.

