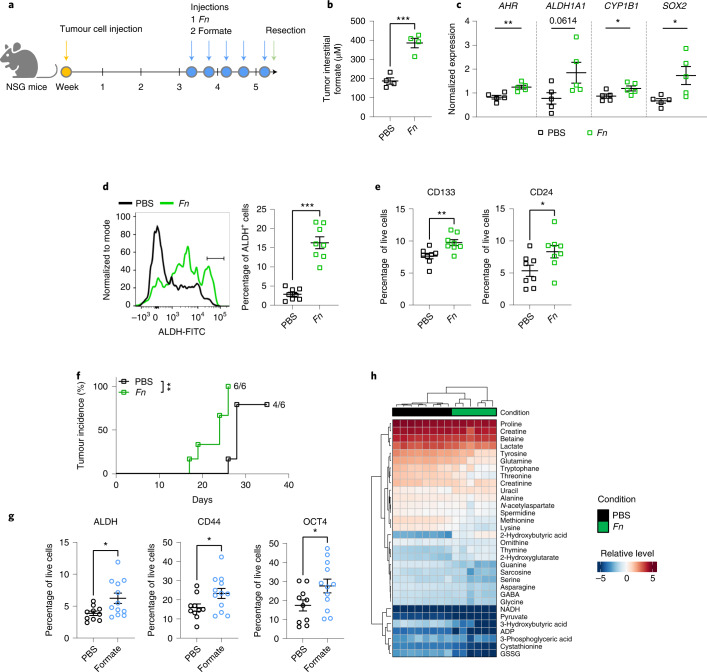
Fig. 6. Fn and formate increase cancer stemness in vivo.
a, Schematic overview of the tumour infection mouse model. SPF NSG mice were subcutaneously injected with HT-29 cells subcutaneously (1 × 10⁶ cells per flank). After tumour formation, tumours were injected with Fn (MOI 10) or PBS (ctrl) or formate (10 mM, 60 μl) for five consecutive injections over 11 d. b, Formate levels in TIF of Fn-injected tumours. TIF volume was only sufficient for processing from n = 4 independently treated tumours per group. c, Gene expression levels of AHR (far left), ALDH1A1 (left), CYP1B1 (right) and SOX2 (far right) as assessed by rt–qPCR for n = 5 independently treated tumours per group. d, ALDH activity assay of Fn-/PBS-infected tumours. Left, representative histogram of ALDH+ cell populations (crossbar) in mouse tumours assessed by FACS. Right, quantification of ALDH activity in tumours on Fn infection. e, CD113 (left) and CD24 (right) expression in mouse tumours after intratumoral injection, as assessed by FACS, n = 8 independently treated tumours per group in d and e. f, Serial transplantation of Fn-treated xenografts. Tumours were explanted at endpoint, dissociated in culture and reinjected subcutaneously in secondary recipient mice at 5,000 cells per flank, n = 6 biologically independent animals per group. Kaplan–Meier analysis of tumour incidence was performed using a Mantel–Cox test, P = 0.0024. g, Expression of ALDH (left), CD44 (middle) and OCT4 (right) in formate-treated and control xenografts as assessed by FACS, n = 10 and n = 12 independently treated tumours for the control and treated conditions, respectively. h, Untargeted metabolite analysis of TIF samples from Fn-/PBS-infected xenografts. Heatmap shows normalized intensities, n = 8 and n = 6 independently treated tumours for the control and treated conditions respectively. Data in b–d (right), e and g are shown as mean ± s.e.m, P = 0.0006 in b, P = 0.0051 in c (far left), P = 0.0482 in c (right), P = 0.0262 in c (far right), ***P < 0.001 in d (right), P = 0.0052 in e (left), P = 0.0380 in e (right), P = 0.0209 in g (left), P = 0.0409 in g (middle) and P = 0.0450 in g (right), unpaired two-sided t-test. *P < 0.05, **P < 0.01, ***P < 0.001.

