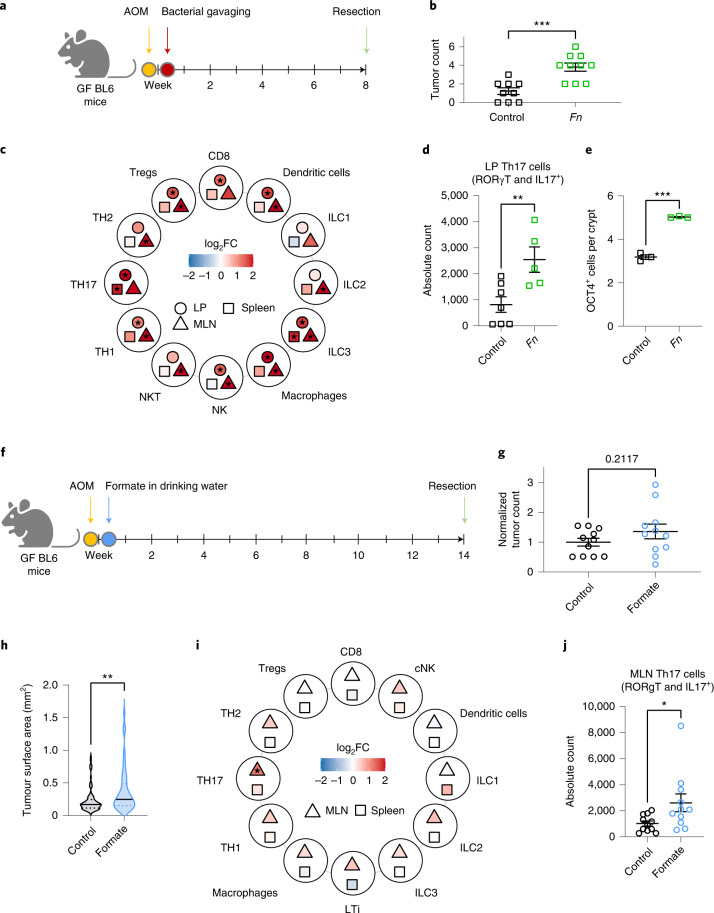
Fig. 7. Fn administration and formate treatment lead to an increase in tumour incidence or tumour size and an increase in Th17 cells.
a, Schematic overview of the experimental setup. Germ-free mice received a single dose of AOM intraperitoneal (10 mg kg−1). After 3 days, mice were gavaged with bacteria (108 CFU per mouse) and euthanized at 8 weeks postinjection. b, Colonic tumour incidence, n = 9 and n = 10 biologically independent animals in the control and treated groups respectively, pooled from two independent experiments. c, Immune cell phenotyping of Fn versus PBS gavaged mice. Heatmap shows estimate (log2 fold change (FC)) of normalized immune cell counts in mouse lamina propria (LP), MLNs and spleens. Filled star indicates P < 0.05, two-tailed least squared means method, d, Th17 cell counts (CD4+IL-17+RORγT+ T cells) in LP from c. One representative experiment is shown with n = 7 and n = 5 biologically independent animals in the control and treated groups respectively, in c and d. e, OCT4+ cells per colonic crypt, n = 3 biologically independent mice, with at least eight crypts per mouse, f, Schematic overview of the experimental setup. Germ-free (GF) mice received a single dose of AOM intraperitoneal (10 mg kg−1) and formate was administered via the drinking water (250 mM) for the duration of the experiment (14 weeks). g,h, Tumour incidence (g) and surface areas (h) in colons of formate-treated mice and controls. i, Immune cell phenotyping of formate-treated mice and controls. Heatmap shows estimate (log2 fold change) of normalized immune cell counts in the MLNs or spleens. Filled star indicates P < 0.05, two-tailed least squared means method. j, Th17 counts (CD4+IL-17+RORγT+) in the MLNs from i. n = 11 biologically independent animals per group from two independent experiments pooled for representation in g,i and j. h, One representative experiment with all tumour surface areas from four independent biological animals per condition. The solid line represents the median and the dotted line represents the upper and lower quartiles. Data in b,d,e,g and j are shown as mean ± s.e.m. P = 0.0004 in b, P = 0.0095 in d, ***P < 0.0001 in e, P = 0.0363 in j, unpaired two-tailed t-test, P = 0.00259 in h, two-tailed nested ANOVA (factor mouse nested within condition). *P < 0.05, **P < 0.01, ***P < 0.001.

