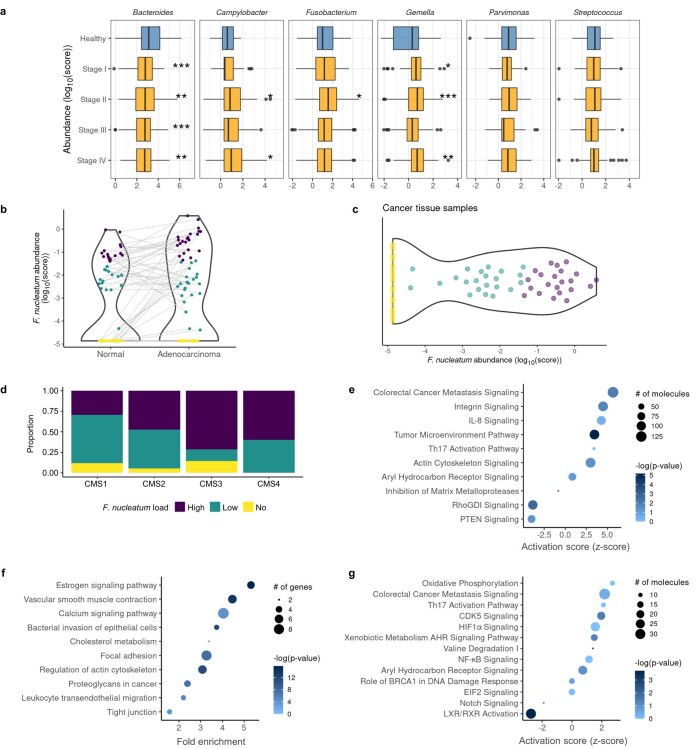
Extended Data Fig. 1. Microbiome composition in CRC patients and pathways identified in Fusobacteriumhigh patients.
a, Abundance of top CRC-enriched and differentially abundant bacteria in tissue per stage (TCGA). Boxplots shows medians with 1st and 3rd quantiles. The whiskers from the hinges to the smallest/largest values represent 1.5*inter-quartile range (IQR). n=108 healthy, n=102 Stage I, n= 209 Stage II, n=163 Stage III and n=86 Stage IV biologically independent donor samples, p=0.000705, p=0.00101, p=0.0000154 and p=0.00153 for Bacteroides in Stages I-IV vs. Healthy respectively, p=0.0112 and p=0.0402 for Campylobacter in Stages II and IV vs. Healthy respectively, p=0.0223 for Fusobacterium in Stage II vs Healthy, p=0.0293, p=0.000608 and p=0.00267 for Gemella in Stages I, II and IV vs. Healthy respectively, pairwise t test. b, Fn abundance in the EGA cohort. PathSeq-analysis for Fn abundance in matching normal vs. adenocarcinoma tissue on RNA-seq data, p=0.00165, paired two-tailed t test. c, Fn tissue abundance distribution in CRC patients of the EGA cohort. Fn was detected via RNA-seq and analyzed for the logarithmic score bacterial distribution (n=69). Quantile-based classification (color code) was applied for the target bacterium (quantcut function from the gtools R package). d, Correlation of Fn abundance with consensus molecular subtypes in CRC. The cohort in c was subjected to gene expression analysis and further classified via the CMScaller R package into CMS as described67. Colored, segregated bars show the proportion of patients with differing fusobacterial loads per CMS. Chi-squared tests were performed for comparing the fusobacterial across all CMS. No significant differences were observed. nCMS1=17, nCMS2=19, nCMS3=7, nCMS4=5. e, IPA analysis of Fusobacteriumhigh vs. no differential gene expression analysis of the TCGA dataset. Plot shows z-scores, p-values, and the number of molecules per pathway. Selected significant pathways are shown (-log(p-value)>1.3). f, KEGG-based GSEA of Fusobacteriumhigh vs. no differential gene expression analysis of the TCGA dataset (pathfindR R package). Plot shows fold enrichment, p-values, and the number of genes per pathway. All significant pathways are shown (p<0.05). g, IPA analysis of Fusobacteriumhigh vs. no differential gene expression analysis of the EGA dataset. Plot shows z-scores, p-values, and the number of enriched molecules per pathway. Selected significant pathways are shown (-log(p-value)>1.3). *p<0.05, **p<0.01, ***p<0.001.

