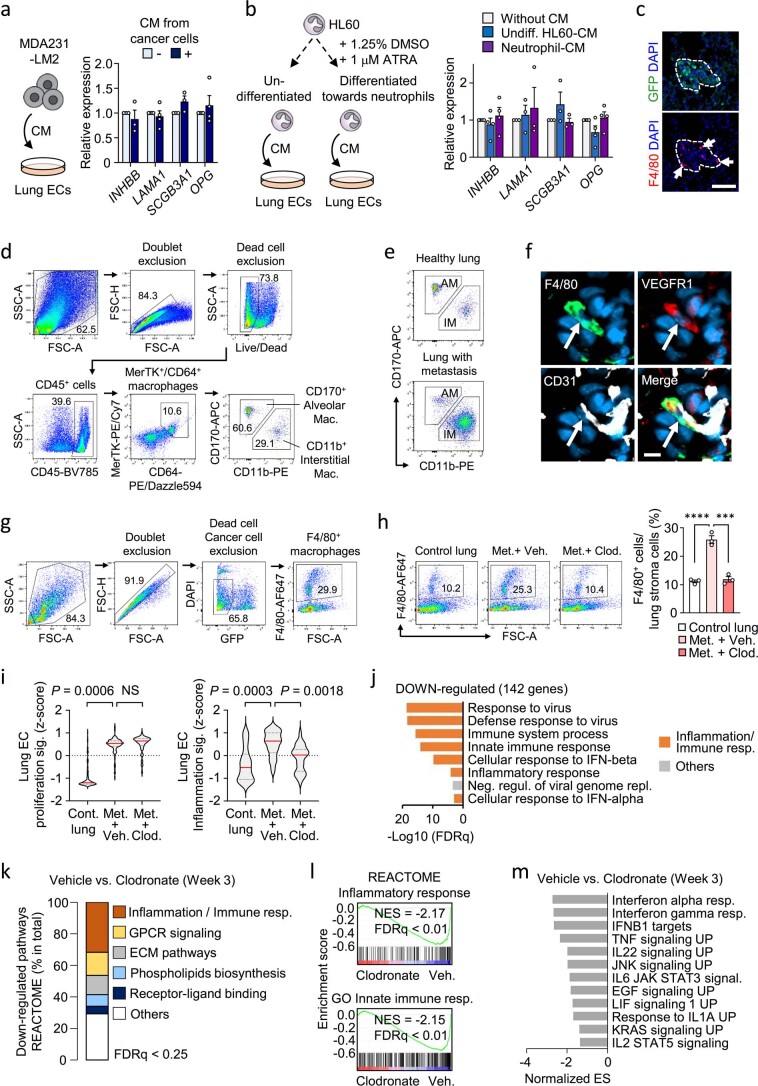
Extended Data Fig. 5. Functional role of macrophages in vascular niches.
a, Expression of four vascular niche factors in human lung ECs treated with CM from MDA231-LM2 breast cancer cells. Schematic of the experiment (left) and relative expression (right). Values are means from 3 (INHBB and SCGB3A1) or 4 (LAMA1 and OPG) independent experiments with s.e.m. b, Expression of the four vascular niche factors in human lung ECs treated with CM from HL60 cells; undifferentiated or differentiated towards neutrophils. Experimental setup (left) and relative expression as means with s.e.m. (right) from 3 (LAMA1 and SCGB3A1) or 4 (INHBB and OPG) independent experiments are shown. c, Immunofluorescence analysis of macrophages (F4/80, arrows) in metastatic nodules in lungs, 2 weeks post intravenous injection of MDA231-LM2 cancer cells (GFP). Cell nuclei were stained by DAPI. Representative example from 4 independent experiments is shown. Scale bar, 100 μm. d,e, Flow cytometry analysis of alveolar (CD170+ CD11b-) and interstitial (CD170- CD11b+) macrophage populations in control mouse lungs and lungs with 4T1-derived metastases. Example of gating strategy (d) and comparison between control and metastatic lungs (e) are shown. f, Immunofluorescence analysis of F4/80 and VEGFR1 expression (markers of interstitial macrophages when combined) and endothelial marker CD31 in lung metastasis. Representative example from 3 independent samples is shown. Scale bar, 10 μm. g,h, Flow cytometry analysis of F4/80+ macrophages in healthy control lung and metastatic lung (week 3) treated with PBS-liposome or clodronate-liposome. Gating strategy example (g) and quantification (h) are shown; n= 3 mice per group. P values were determined by one-way ANOVA with Dunnett’s multiple comparison test. ***P< 0.001 and ****P< 0.0001. i, Lung EC proliferation signature (Supplementary Table 3) and lung EC inflammation signature (Supplementary Table 4) expressed in ECs isolated from metastatic lungs under indicated conditions. P values were calculated with averaged z-score of genes within signatures by one-way ANOVA with Dunnett’s multiple comparison test; n = 3 for each group. NS, not significant. j, GO term analysis of down-regulated genes (log2FC< −0.75, FDR< 0.25) in lung ECs after macrophage-depletion. k, Composition of down-regulated REACTOME pathway gene clusters with FDR< 0.25. l, GSEA of “Inflammatory response” (C2 in MSigDB, top) and “Innate immune response” (C5 in MSigDB, bottom) signatures in lung ECs from mice treated with clodronate-liposome. NES, normalized enrichment score. m, Downregulated gene clusters of cellular signaling in lung ECs isolated from metastasis-bearing mice after macrophage depletion. GSEA was performed using Hallmark and C2 CGP in MSigDB. Signatures with FDR< 0.25 are shown. ES, enrichment score.

