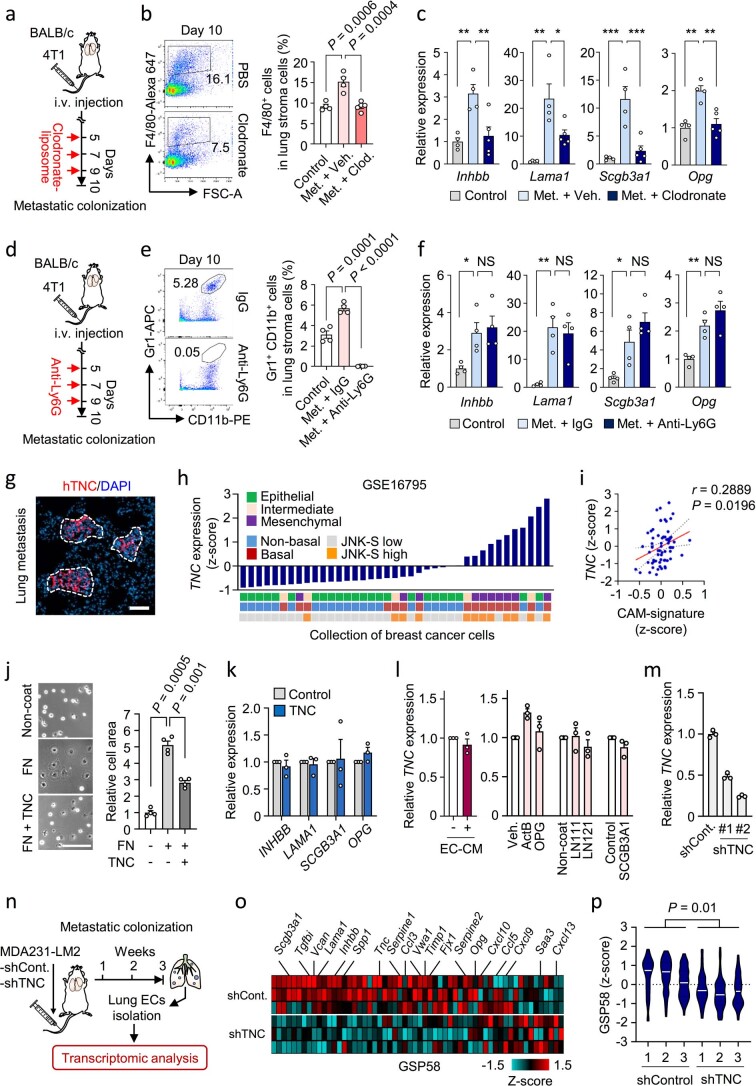
Extended Data Fig. 6. Analysis of innate immune cells and TNC in vascular niches in lungs.
a, Scheme of macrophage-depletion by transient treatment with clodronate-liposome to BALB/c mice after intravenous injection of 4T1 cancer cells. b, Flow cytometry analysis of F4/80+ macrophages in metastatic lung treated with PBS-liposome or clodronate-liposome; n = 4 mice (control and metastasis with PBS-liposome (vehicle)) and n = 5 mice (metastasis with clodronate-liposome). Means with s.e.m. are shown. P values were determined by one-way ANOVA with Dunnett’s multiple comparison test. c, Expression of vascular niche components in lung ECs isolated from control healthy lung or metastatic lung treated with PBS-liposome or clodronate-liposome; n = 4 mice (control and metastasis with vehicle) and n = 5 mice (metastasis with clodronate-liposome). Shown are means with s.e.m. P values were calculated by one-way ANOVA with Holm–Sidak’s multiple comparison test. *P < 0.05, **P < 0.01 and ***P < 0.001. d, Scheme of neutrophil depletion by transient treatment with anti-Ly6G antibody in BALB/c mice after intravenous injection of 4T1 cells. e, Flow cytometry analysis of Gr1+CD11b+ neutrophils in metastatic lung treated with IgG or anti-Ly6G antibody; n = 4 mice per group. Data are means with s.e.m. P values were determined by one-way ANOVA with Dunnett’s multiple comparison test. f, Expression of niche factors in lung ECs isolated from control healthy lung or metastatic lung treated with IgG or anti-Ly6G antibody; n= 4 mice. Means with s.e.m. are shown. P values were calculated by one-way ANOVA with Holm-Sidak’s multiple comparison test. *P< 0.05 and **P< 0.01. NS, not significant. g, Immunofluorescence analysis showing accumulation of cancer cell-derived hTNC (human TNC) in metastatic nodule at 2 weeks after intravenous injection of MDA231-LM2 cells. Nuclei were stained by DAPI. Shown is a representative from 3 independent experiments. Scale bar, 100 μm. Dashed lines indicate nodule margins. h, TNC expression in breast cancer cell lines of different phenotype (epithelial/intermediate/mesenchymal), breast cancer subtype (Non-basal/Basal) and activity of JNK signaling. i, Correlation analysis of TNC and classically activated macrophage-signature (CAM-S) in 65 metastases samples from breast cancer patients. Linear regression with Pearson correlation r and two-tailed P values are shown. j, Analysis of EC spreading on fibronectin (FN) or TNC and FN coated plates. Scale bar, 200 μm. Shown are means with s.e.m. P values were determined with repeated measures one-way ANOVA with Dunnett’s multiple comparison test from 4 independent experiments. k, Expression of niche factors in lung ECs in response to TNC. Data are means with s.e.m. from 3 independent experiments. l, Expression of TNC in breast cancer cells stimulated with EC-derived CM or with indicated niche components. Shown are means with s.e.m. from 3 independent experiments. m, TNC expression in MDA231-LM2 cancer cells transduced with shControl or shTNC. Means with s.e.m. of 3 technical replicates from qPCR results are shown. n-p, GSP58 expression in ECs isolated from metastasis formed by shControl or shTNC MDA231-LM2 breast cancer cells. Experimental procedures (n), heatmap of GSP58 expression (o) and violin plot of GSP58 expression (p) in ECs from TNC knockdown metastases are shown. P values were determined by unpaired two-tailed t-test from 3 biological replicates.

