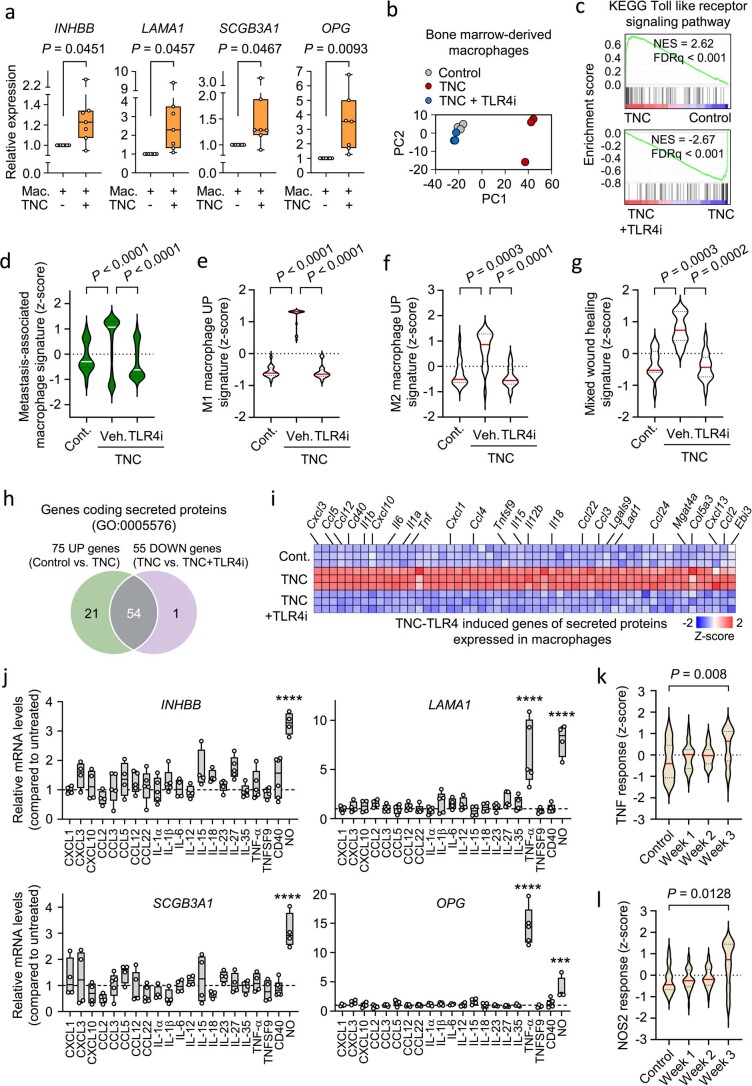
Extended Data Fig. 7. Macrophage phenotype and secreted factors in the vascular niche.
a, Expression of INHBB, LAMA1, SCGB3A1, and OPG in ECs cocultured with control or TNC-stimulated macrophages. Expression was determined by qPCR. P values were calculated by paired one-tailed t test from 7 independent experiments. Boxes show median with upper and lower quartiles and whiskers indicate maximum and minimum values. b, Principal component analysis of bone marrow-derived macrophages treated with TNC or combination of TNC and TLR4i. c, GSEA showing enrichment of Toll-like receptor signaling pathway (KEGG) in macrophages treated with TNC or TNC+TLR4i. FDRs were determined from P values calculated by random gene set permutation test. d-g, Violin plot analyses of indicated gene signatures within the dataset of TNC-TLR4 stimulated macrophages. Gene signatures: metastasis-associated macrophages39 (up-regulated genes in metastasis-associated macrophages with log2FC> 2), M1 macrophages40, M2 macrophages40 and wound healing41. P values were determined by one-way ANOVA with Dunnett’s multiple comparison test from 3 biological replicates. h, Venn diagram showing number of genes of secreted proteins in bone marrow-derived macrophages, that are induced by TNC in a TLR4-dependent manner. i, Heatmap of genes induced by TNC and repressed by TLR4 inhibition. Selected examples are highlighted. j, Screen of 21 candidate factors to identify inducers of the four niche components. 20 candidates are from the list in panel i and one (NO, induced by diethylentriamine NONOate) was selected based on Nos2 upregulation by TNC (Fig. 7d). ST1.6R endothelial cells were stimulated with indicated factors and expression of INHBB, LAMA1, SCGB3A1 and OPG analyzed by qPCR. ***P< 0.001, ****P< 0.0001. P values were determined by one-way ANOVA with Dunnett’s multiple comparison test from minimum 4 independent experiments. Boxes show median with upper and lower quartiles and whiskers indicate maximum and minimum values. k,l, Violin plots analyzing expression of TNF response signature (SANA_TNF signaling, C2 in MSigDB) and NOS2 response signature (ZAMORA_NOS2 targets up, C2 in MSigDB) in ECs isolated from healthy mouse lungs or lungs harboring metastases. P values were calculated with an unpaired two-tailed t test from 3 biological replicates.

