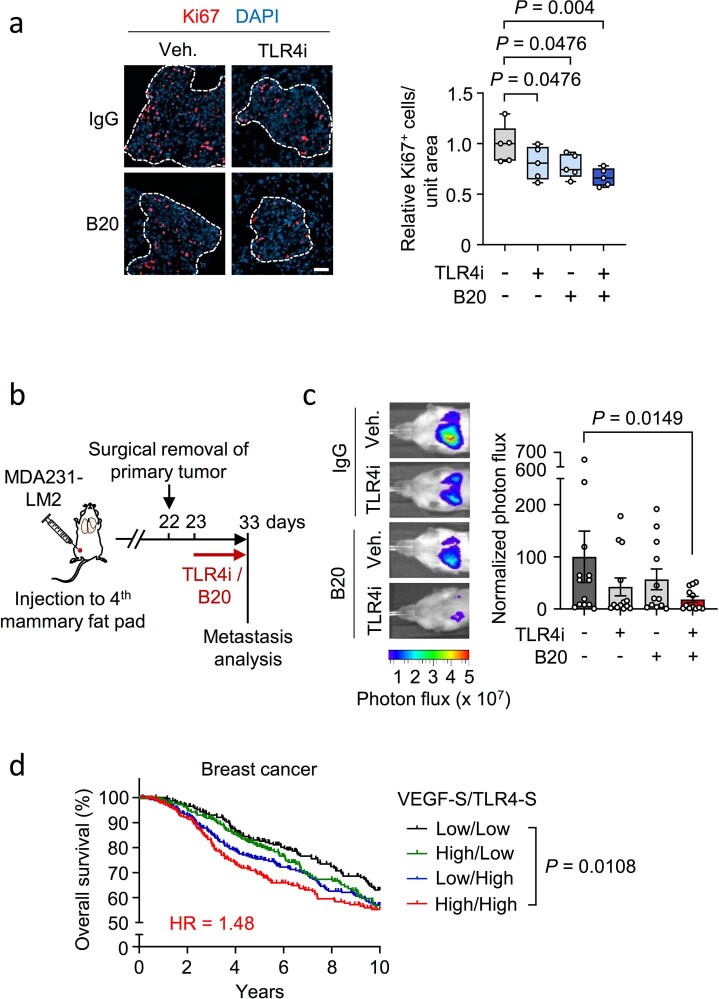
Extended Data Fig. 10. TLR4 and VEGF function in breast cancer metastasis.
a, Immunofluorescence analysis of Ki67 expression in metastatic nodules after lung colonization by MDA231-LM2 breast cancer cells followed by treatment with TLR4i, anti-VEGF (B20) or combination of the two. Left, representative fluorescence images. Right, quantification; n= 5 mice for each group. Boxes show median with upper and lower quartiles and whiskers indicate maximum and minimum values. P values were determined by one-tailed Mann-Whitney test. Scale bar, 50 μm. b,c, Metastasis analysis in an orthotopic metastasis model where mice were treated with TLR4i, B20 or both, after the primary tumors had been surgically removed. Shown are experimental procedures (b) and quantification of metastasis (c) with representative examples of bioluminescence in lungs (left) and normalized photon flux (right); Control n= 13 mice; TLR4i n= 13 mice; B20 n= 12 mice; TLR4i + B20 n= 12 mice. Data are means +/- s.e.m. P value was calculated by one-tailed Mann-Whitney test. d, Kaplan Meier analysis showing overall survival of breast cancer patients (METABRIC discovery) stratified according to expression of VEGF signature (VEGF-S)42 and TLR4 signature (TLR4-S)43. Survival analysis spanning 10 years is shown. Patients were divided based on the median value of each signatures; Patient groups: VEGF-S/TLR4-S High/High n= 239; High/Low n= 259; Low/High n= 264; Low/Low n= 233. Shown is hazard ratio (HR) for the comparison VEGF-S/TLR4-S low/low vs high/high. P value was determined by Log-rank test.

