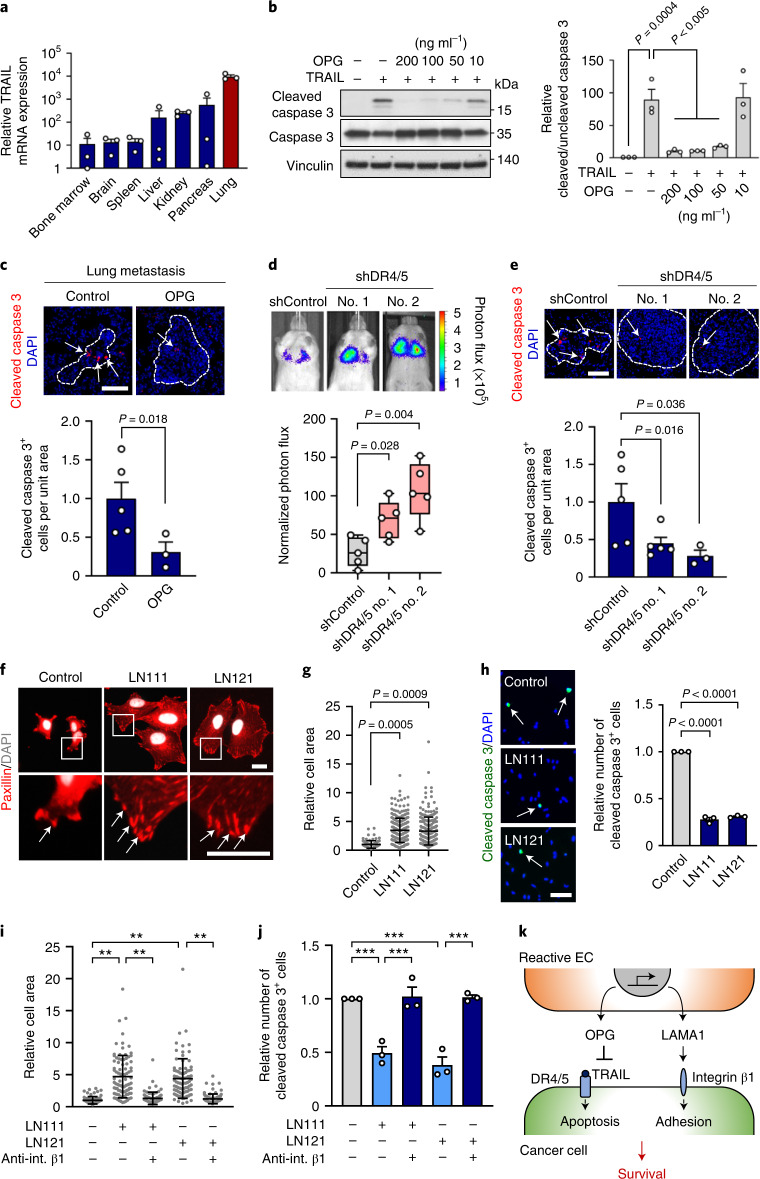
Fig. 5. OPG and LAMA1 regulate breast cancer cell survival.
a, TRAIL messenger RNA levels in different organ tissues isolated from NSG mice; n =3 mice per group. Expression was determined by qPCR. Data are means with s.e.m. b, Left, immunoblot analysis of cleaved caspase 3 expression in MDA231-LM2 cells treated with TRAIL (50 ng ml–1) and with indicated concentrations of OPG. Right, quantification based on the ratio between cleaved and uncleaved caspase 3. Means with s.e.m. from three independent experiments are shown. Statistical analysis was performed with one-way ANOVA and Dunnett’s multiple comparison test. c, Immunofluorescence analysis of cleaved caspase 3 expression in lung metastasis from mice injected with OPG-expressing MDA231 cancer cells. Top, representative examples; cell nuclei stained with DAPI. Scale bar, 100 μm. Bottom, quantification; n = 5 (control) and n = 3 (OPG). Values are means with s.e.m. P value was determined by one-tailed Mann–Whitney test. d, Lung colonization of MDA231 cancer cells transduced with shRNA control (shControl) or shRNA against death receptors 4 and 5 (shDR4/5, two independent hairpins). Representative bioluminescence images (top) and normalized photon flux (bottom) 21 days after intravenous injection are shown; n = 5 mice per group. Boxes show median with upper and lower quartiles, and whiskers indicate maximum and minimum. P values were calculated by one-tailed Mann–Whitney test. e, Cleaved caspase 3 analysis of lung metastasis as in d. Top, representative examples; nuclei stained by DAPI. Scale bar, 100 μm. Bottom, quantification; n = 5 mice (control and shDR4/5 no. 1) and n = 3 mice (shDR4.5 no. 2). Data are means with s.e.m. P values were determined by one-tailed Mann–Whitney test. f, Immunofluorescence analysis of paxillin expression in breast cancer cells plated on LN111 or LN121. DAPI was used to stain nuclei. Arrows indicate dense paxillin at focal adhesions; n = 3. Scale bar, 20 μm. g, Analysis of spreading of breast cancer cells plated onto LN111 or LN121. Shown are relative cell areas of all cells examined over three independent experiments, with means and s.d. h, Expression of cleaved caspase 3 in breast cancer cells plated on LN111 or LN121 matrix. Data are means with s.e.m. from three independent experiments. Scale bar, 100 μm. i,j, Integrin β1 function in laminin-induced cell spreading and survival. Relative cell area (i) and cleaved caspase 3 expression (j) were analyzed in cells plated on LN111 or LN121 matrix with or without neutralizing antibody against integrin β1 (anti-int. β1). Shown are means ± s.d. with relative cell area of all examined cells (i) or means with s.e.m. (j) from three independent experiments. P values were determined by one-way ANOVA with Dunnett’s (g,h) or Tukey’s (i,j) multiple comparison test from three independent experiments. **P< 0.01, ***P< 0.001. k, Schematic summarizing OPG and LAMA1 functions in breast cancer metastasis.

