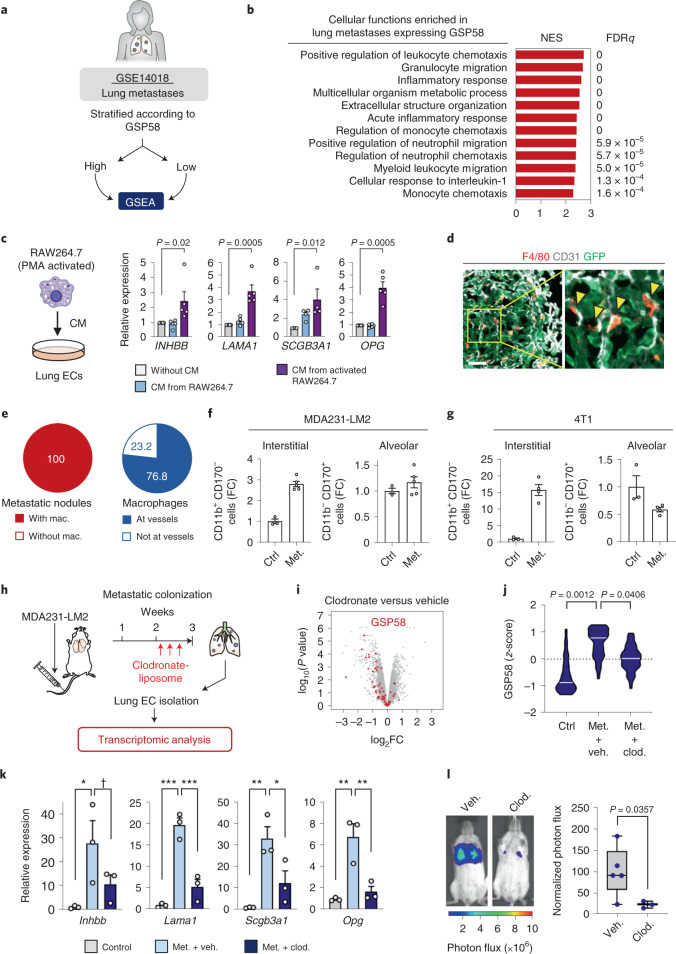
Fig. 6. The endothelial niche is regulated by perivascular macrophages in lung metastasis.
a, Schematic overview of GSEA setup used to analyze datasets from human metastasis samples ranked according to GSP58. All patients with lung metastasis (16 patients) were selected from GSE14018. b, Cellular functions enriched in GSP58-expressing human lung metastases. Cellular functions are ranked based on NES. FDR was determined from P values calculated by random permutation tests. c, Expression of niche factors in ECs treated with CM from naïve or activated macrophage cell line RAW264.7. Means with s.e.m. from either four (SCGB3A1) or five (INHBB, LAMA1 and OPG) independent experiments are shown. Statistical analysis was performed with ratio-paired, two-tailed t-tests. d, Immunofluorescence analysis of endothelial cells (CD31, white), macrophages (F4/80, red) and MDA231-LM2 (GFP, green) in metastatic nodules from mouse lung. Shown are representative images from four independent samples. Arrowheads indicate perivascular localization of macrophages. Scale bar, 50 μm. e, Quantification (percentages) of nodules with infiltrated macrophages (mac.) or macrophages associated with vessels. f,g, Macrophage subpopulations within lungs of healthy mice or mice harboring lung metastases, analyzed by flow cytometry. Interstitial and alveolar macrophages were quantified in MDA231-LM2- (f) and 4T1-mediated (g) lung metastases in NSG or BALB/c mice, respectively; n = 3 (control), n = 5 (metastasis, f) and n = 4 (metastasis, g). Means with s.e.m. are shown. h, Experimental setup of clodronate (clod.)-mediated macrophage depletion in mice with lung metastasis, followed by transcriptional analysis of lung ECs. i, Volcano plot showing differential expression of genes in lung ECs after macrophage depletion (GSP58 highlighted in red). j, Violin plot showing expression of GSP58 in ECs from lungs of metastasis-bearing mice following macrophage depletion. P values were determined by one-way ANOVA with Dunnett’s multiple comparison test; n = 3 for each group. k, Expression of endothelial niche factors in purified lung ECs as in h–j. mRNA levels were determined by qPCR; n = 3 mice. Shown are means with s.e.m., and P values were calculated by one-way ANOVA with Holm–Sidak’s multiple comparison test. *P < 0.05, **P < 0.01, ***P < 0.001, ✝P = 0.086. l, Lung colonization of MDA231-LM2 cells in mice after clodronate-liposome treatment. Representative bioluminescence (left) and normalized photon flux at day 14 (right); n = 5 mice (vehicle (veh.) and PBS-liposome) and n = 3 mice (clodronate-liposome). Boxes show medians with upper and lower quartiles, and whiskers represent minimum and maximum values. P values were calculated by one-tailed Mann–Whitney test.

