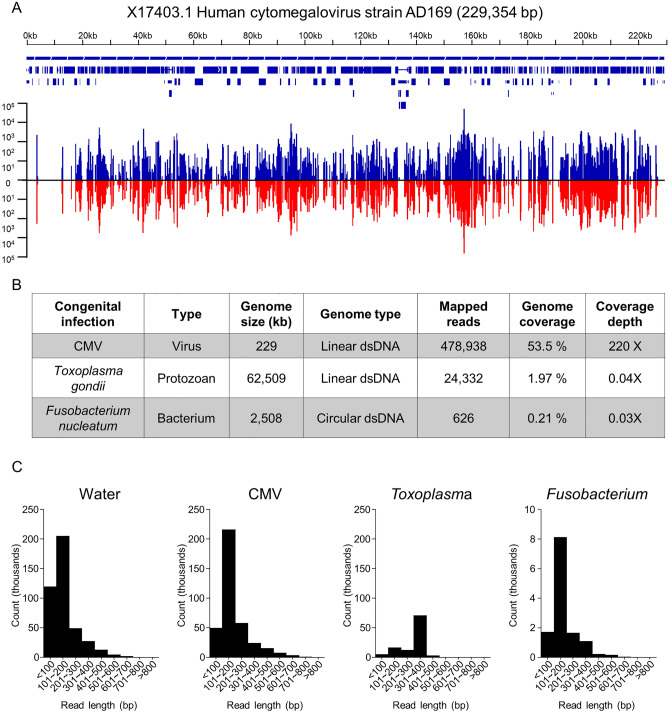
Figure 2.
Detection of known infections. (A) Genomic graph illustrating the coverage and depth of CMV in the CMV-positive amniotic fluid sample (against reference CMV genome NC_006273.2). Top: gene location and genomic feature annotations from RefSeq. Bottom: number of reads mapped to genome. Blue lines above and red lines below the horizontal line indicate forward and reverse reads, respectively. The graph is generated using Bedfile and genomic snapshots from IGV. (B) Table showing genome coverage statistics for CMV, F. nucleatum, and T. gondii. (C) Histograms showing insert lengths (specifically, mapped paired end read separation distance) in water (left), CMV infection (middle left) and F. nucleatum infection (middle right) and T. gondii infection (right).

