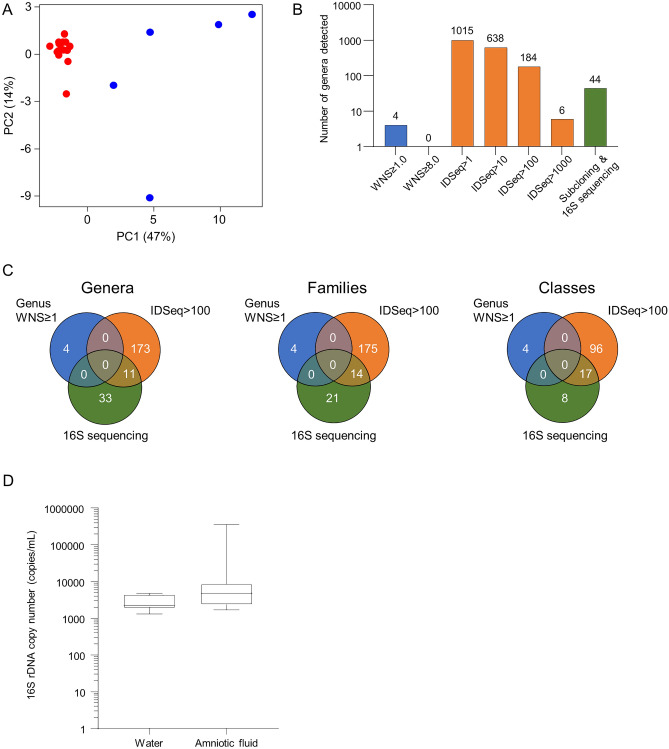
Figure 4.
Microbial detection varies by method used. (A) Principal component analysis illustrating sample variance between water (blue) and amniotic fluid (red). (B) Bar graph showing the number of genera detected using our method (blue), IDSeq at different thresholds (orange), and 16S sequencing (green). (C) Venn diagrams comparing the number of genera, families, and classes detected in amniotic fluid samples using our method (blue), IDSeq (orange), and 16S sequencing (green). (D) EvaGreen 16S rDNA droplet digital PCR box plot comparing total volume of bacterial rDNA signatures in water controls and amniotic fluid (p > 0.05 for difference).

