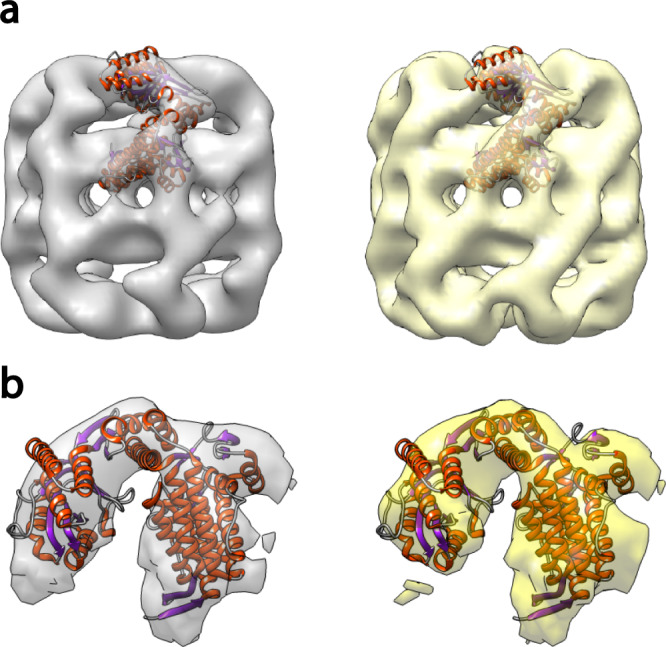
Fig. 3. Single subunit density maps of GroEL from either matrix-landing (left, gray) or conventional samples (right, yellow).

a Fit of a single subunit PDB reference ribbon structure to the overall models obtained by either method. Note the exposed helices in both models that are not contained within the calculated model density. These data confirm that the matrix-landing sample is no different than the result obtained by conventional negative staining TEM. b Expanded view of a single GroEL subunit where matrix-landed reconstruction is gray and conventionally prepared is yellow. Ribbon structure taken from PDB:5W0S.
