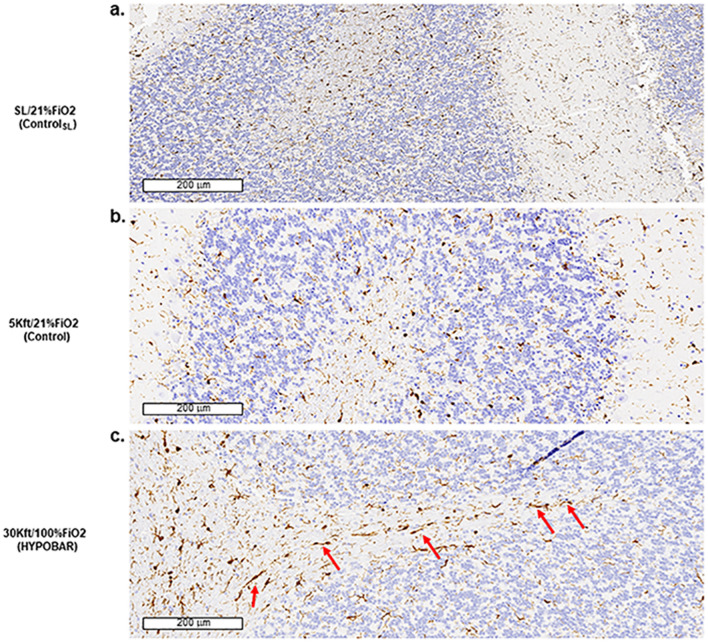
Figure 4.
Immunohistochemistry (IHC) outcomes of IBA1 antibody. Panels (a–c) are at a scale of 200 microns (µm). Note in panel c the presence of rod-shape microglia cells in the cerebellar “arbor vitae” in the 30Kft/100%FiO2 (HYPOBAR) group in comparison to the other two groups (SL/21%FiO2 and 5Kft/21%FiO2). SL sea level, FiO2 fraction inspired oxygen, HYPOBAR nonhypoxic-hypobaric condition, ft feet, ControlSL SL/21%FiO2, Control 5Kft/21%FiO2.

