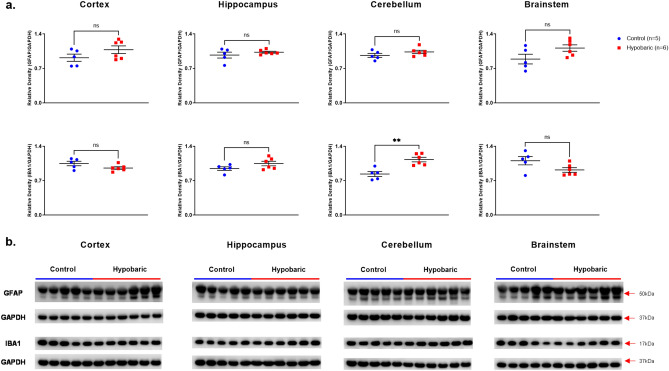
Figure 8.
GFAP and IBA-1 Protein Expression Following Hypobaric Exposure. (a) Histograms representing the densitometric ratio of levels of GFAP and IBA1 with respect to GAPDH in the Control (blue spots) vs. HYPOBAR (red squares) group as measured in the frontal cortex, hippocampus, cerebellum and brainstem. All gels were run in duplicate and data represents the average of 2 runs per sample. Error bars represent standard error of the mean (SEM). *p < 0.05; **p < 0.01 (two-tailed unpaired t-test). (b) Representative western blots for antibodies used. Full length blots are shown in Supplementary Figs. 3–9.

