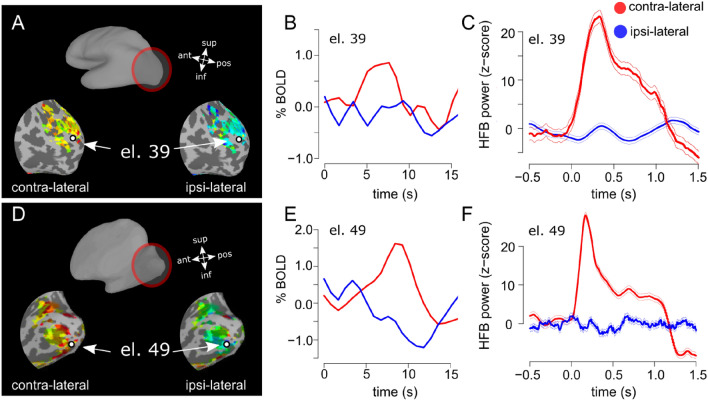
Fig. 3.
Representative single electrodes, BOLD and HFB power. Panel A, electrode location over the reconstructed and inflated brain surface superimposed to contra-lateral and ipsi-lateral fMRI activity, P1. Panel B: HRF for locations corresponding to the same representative selected electrode, for contra- and ipsi-lateral conditions (see “ECoG–fMRI co-localization and local HRF response”). Panel C, HFB responses for the representative electrode. An increase in HFB power is observed in the contra-lateral condition but not for the ipsi-lateral (error bars indicate ± 1 standard error, 15 trials per condition). Stimulus onset is at 0 s. Stimulus duration was 0.81 s and 0.5 s for the fMRI (B) and ECoG (C) measurements, respectively. Panels D–F, same as A–C for P2

