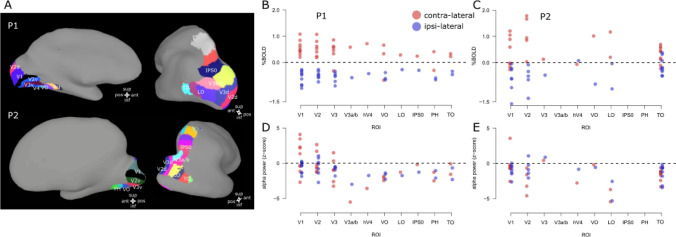
Fig. 5.
Electrode location along ROIs and activity (%BOLD and alpha power). Panel A: visually responsive ROIs based on the atlas provided by Wang et al. (2015) and the standardized surfaces in SUMA (Saad and Reynolds 2012). Panels B, C: %BOLD signal change along each ROI and experimental condition (contra-lateral and ipsi-lateral) for P1 and P2, each dot represents a single electrode. PBR is associated with the contra-lateral condition and NBR with the ipsi-lateral condition throughout the visual hierarchy. Panels D, E: alpha power (z-scored) along each ROI and experimental condition (contra-lateral and ipsi-lateral) for P1 and P2. Contralateral alpha power varies between as well as within cortical area. Ipsi-lateral alpha power on the other hand remains largely negative along the visual hierarchy

