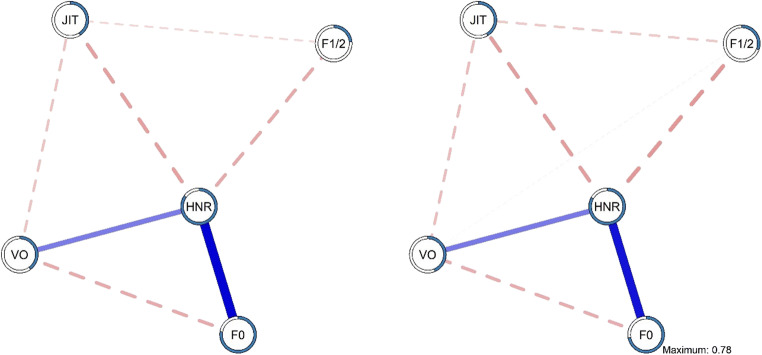
Fig. 2.
Unique associations between the voice parameters pre- (a; left) and post-stressor (b; right). Note. Edges in the models represent the unique associations between each of the nodes. Edge thickness reflects the strength of association, where strong associations are presented using thicker edges. Blue/Full edges represent positive associations, whereas red/dashed edges represent negative associations; the edge weights presented in the model can also be found in the edge weight matrix (Supplemental Tables 6, 7). Node predictability (R2) is visualized as a pie chart around each node and can also be found in Supplementary Table 1

