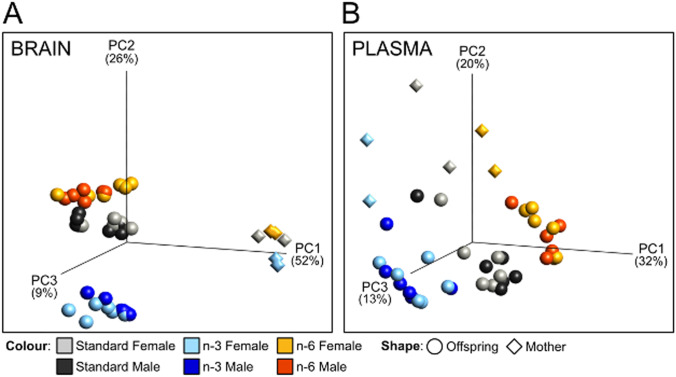
Fig. 1.
Principal component analysis of fatty acid composition in brain and blood plasma. 3D Principal component analysis plots showing distribution of samples based on composition of fatty acids in brain (a) and blood plasma (b) of pups and dams fed three different diets. The plots show clustering of samples in all dimensions (diet, tissue and generation). Colour depictions for standard diet: grey for females, black for males; n-6 diet: yellow for females, red for males; n-3 diet: light blue for females, dark blue for males. Mothers (n = 2/diet) are depicted by diamonds and pups (n = 11–12/diet) by circles

