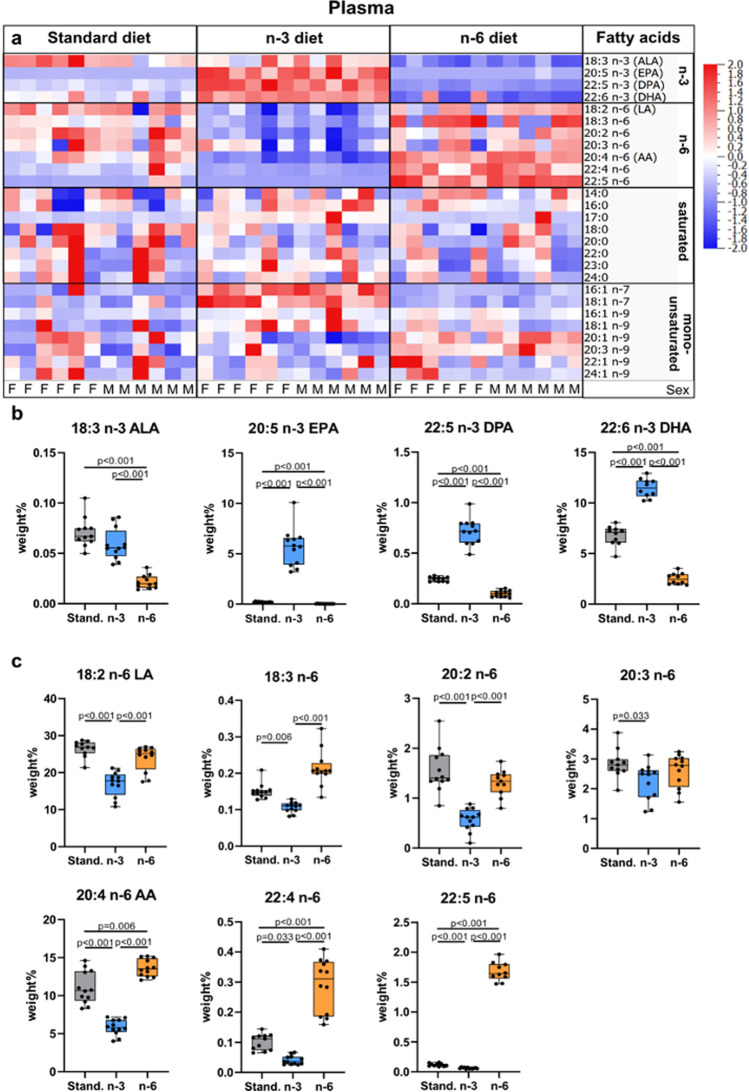
Fig. 2.
Phospholipid fatty acid composition in blood plasma of offspring. Heat map of fatty acids analyzed in blood plasma of offspring from mothers fed a standard, n-3 enriched or a n-6 enriched diet. Each column refers to one animal and each row shows levels of a specific fatty acid. Each fatty acid level was normalized over all samples using Z-score normalization and is shown using a colour scheme based on Z-score distribution from -2 to 2. Sex of pups as indicated: F for females and M for males. (a) Levels of n-3 fatty acids in the blood plasma of offspring from mothers fed a standard (Stand.), n-3 enriched or a n-6 enriched diet (b). Levels of n-6 fatty acids in blood plasma of offspring from mothers fed a standard, n-3 enriched or a n-6 enriched diet (c). Data are presented as median with quartiles and whiskers representing range as well as plotting individual data (n = 11–12/diet). One-way ANOVA with post-hoc Tukey’s test, Welch’s ANOVA with post hoc Dunnett’s test or Kruskal–Wallis with post-hoc Dunn’s multiple comparison test was performed to compare groups. Individual p-values are listed within figures for data that are significantly different

