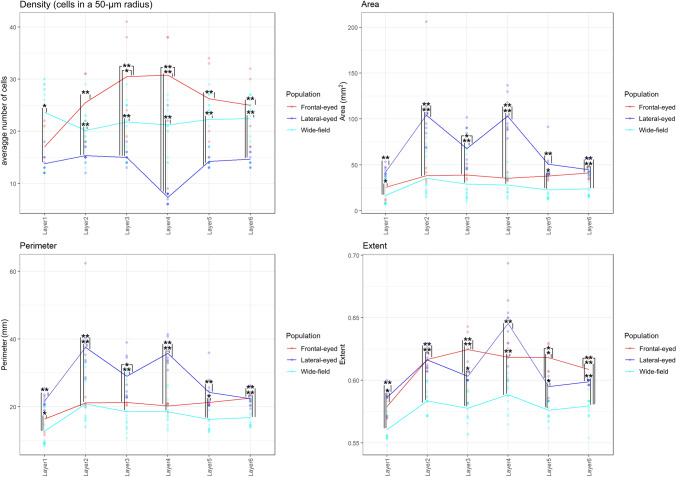
Fig. 32.
Graphical linear distribution of selected parameters of the density (median number of cells found in a 50-micron radius around a given cell, top left panel), size (area and perimeter in microns, top right and bottom left panels) and shape (extent = ratio of pixels in the region to pixels in the total bounding box, returned as a scalar. Computed as the Area divided by the area of the bounding box) (bottom right panel) domains by layer for our samples regrouped by eye position. Significant differences are marked by asterisks (*for p ≤ 0.05; **for p ≤ 0.01)

