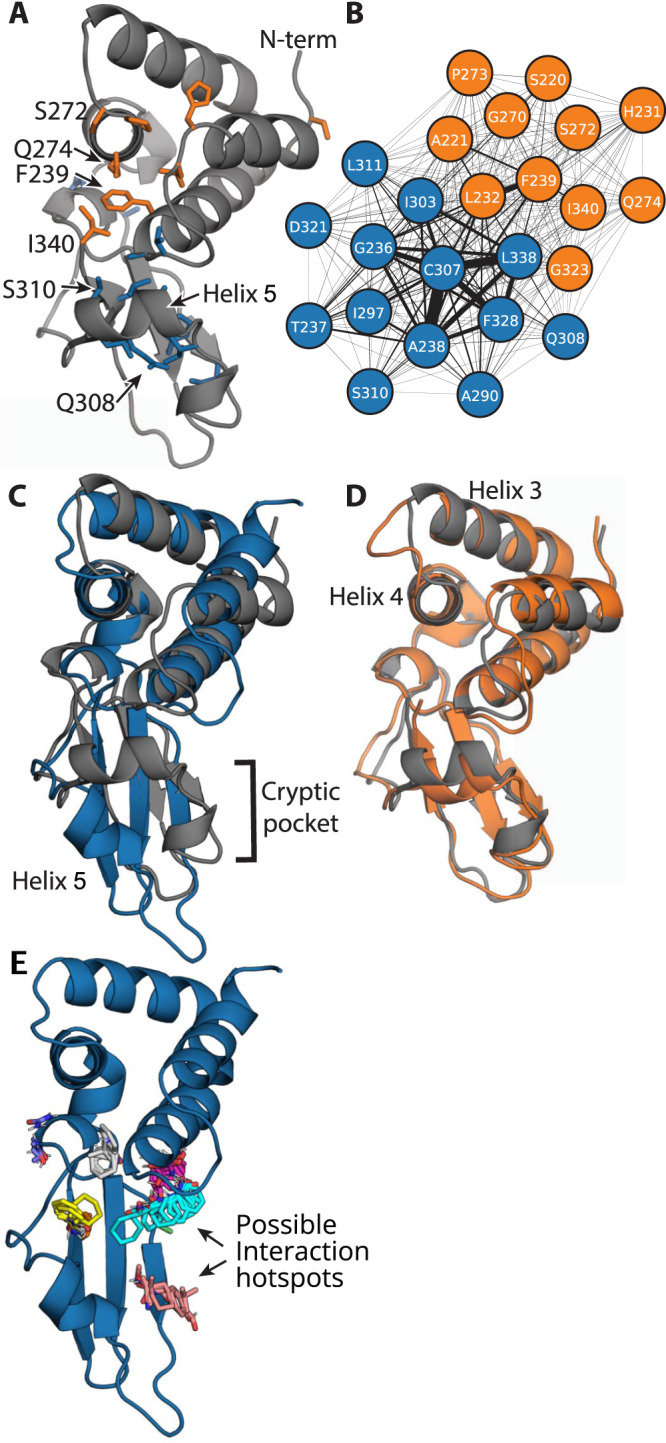
Fig. 2. Exposons identify a large cryptic pocket and suggest potential allosteric coupling.

A Structure of VP35’s IID highlighting residues in two exposons (blue and orange), the N-terminus (N-term), and C-terminus (I340) (PDB ID 3FKE). B Network representation of the coupling between the solvent exposure of residues in the two exposons. The edge width between residues is proportional to the mutual information between them. C Structure highlighting the opening of a cryptic pocket via the displacement of helix 5 that gives rise to the blue exposon. D Structure highlighting the conformational change that gives rise to the orange exposon overlaid on the crystal structure (gray) to highlight that the rearrangements are subtler than in the blue exposon. E FTMap results for the main cryptic pocket as shown in (C) and hotspots where a variety of small organic probes (multicolored sticks) form energetically favorable interactions. The probe molecules are intended to capture different drug-like interactions (such as hydrogen bonding and Van der Waals contacts) and include acetamide, acetonitrile, acetone, acetaldehyde, methylamine, benzaldehyde, benzene, isobutanol, cyclohexane, N,N-dimethylformamide, dimethyl ether, ethanol, ethane, phenol, isopropanol, or urea47,68–70.
