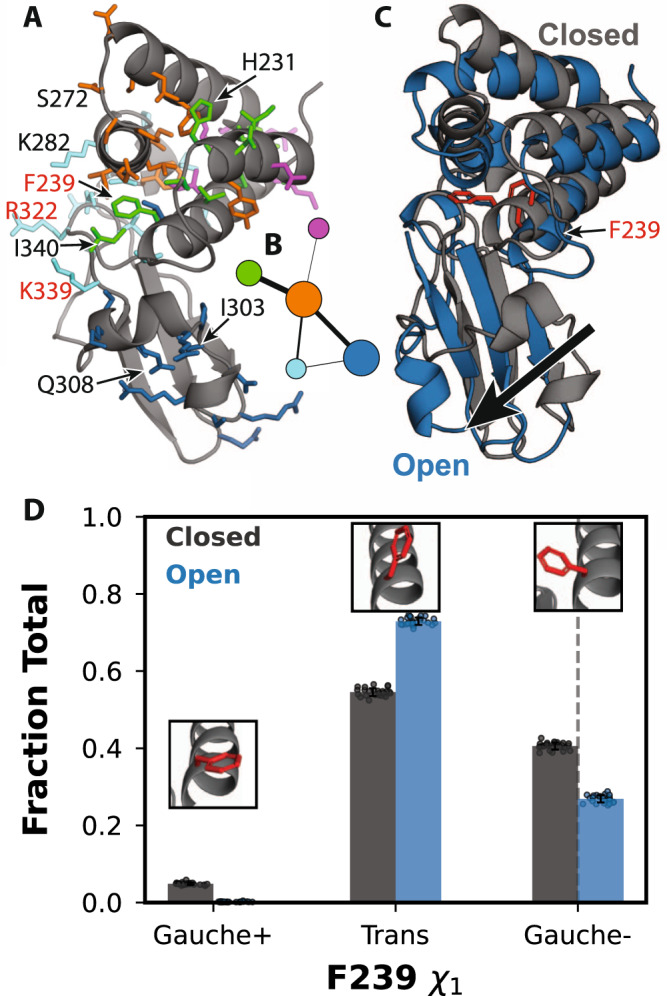
Fig. 3. Allosteric network revealed by the CARDS algorithm.

A Structure of VP35’s IID with residues in the allosteric network shown in sticks and colored according to which of five communities they belong to. Substitution of residues labeled in red with alanine disrupts binding to dsRNA blunt ends and results in a dramatic reduction in immune suppression. B Network representation of the coupling between communities of residues, colored as in (A). Node size is proportional to the strength of coupling between residues in the community, and edge widths are proportional to the strength of coupling between the communities. C Representative states of the correlated changes from the DiffNet. In gray is a structure with a closed pocket and in blue is a structure from MD simulation with an open pocket. F239 is shown in red sticks for orientation. D Distribution of F239 χ1 from the MSM with respect to states wherein the pocket is open (blue) or closed (black) for the three rotamers. The bar height is mean value from 25 bootstrapped MSMs (dots) of the sum of the population of all states in the MSMs with the specified rotamer. Insets show the conformation of F239 with the highest probability within the region of a given peak in the distribution as sampled in our MSM. The black dashed line at the Gauche position corresponds to the calculated value of F239 χ1 from PDB 3L26. Error bars are standard deviation from the mean of bootstrapped values from recalculating the MSM twenty-five times (see “Methods”). Source data are provided as a Source Data file.
