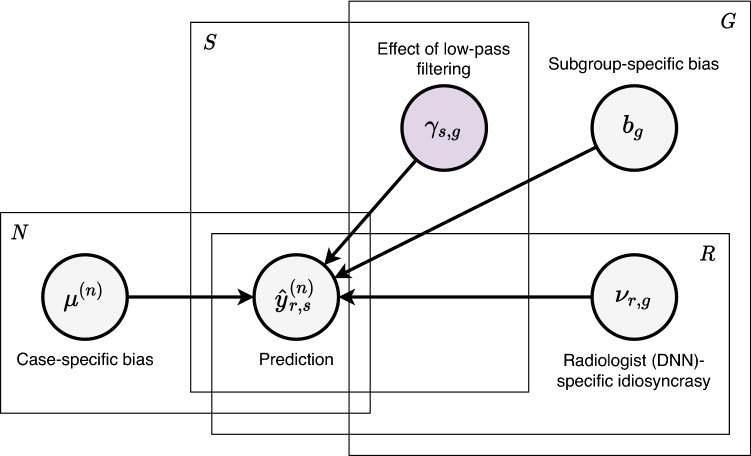
Figure 3.
Probabilistic model. Our modeling assumption is that each prediction of radiologists and DNNs is influenced by four latent variables. is radiologist (DNN) r’s prediction on case n filtered with severity s. As for the latent variables, represents the bias for subgroup g, is the bias for case n, is the effect that low-pass filtering with severity s has on lesions in subgroup g, and is the idiosyncrasy of radiologist (DNN) r on lesions in subgroup g. Our analysis relies on the posterior distribution of , as well as the posterior predictive distribution of . The other latent variables factor out potential confounding effects. Figure created with drawio v13.9.0 https://github.com/jgraph/drawio.

