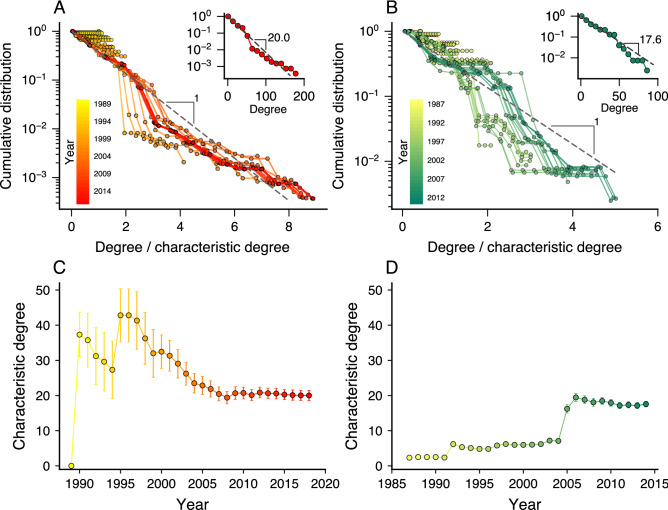
Figure 3.
Degree distributions of corruption networks are approximated by exponential models with characteristic degrees that seem to approach a constant value with the network growth. Complementary cumulative distributions of the node degree divided by the characteristic degree for each year (indicated by the color code) of the (A) Spanish and (B) Brazilian networks. The insets show the degree distributions for the latest stage of the network of each country. The approximately linear behavior of these curves on a log-linear scale and the good quality collapse of the distributions indicate that the exponential model approximates well the degree distributions. Evolution of the characteristic degree for the (C) Spanish and (D) Brazilian corruption networks. The markers indicate the maximum-likelihood estimate of the characteristic degree in each year and the error bars stand for 95% bootstrap confidence intervals.

