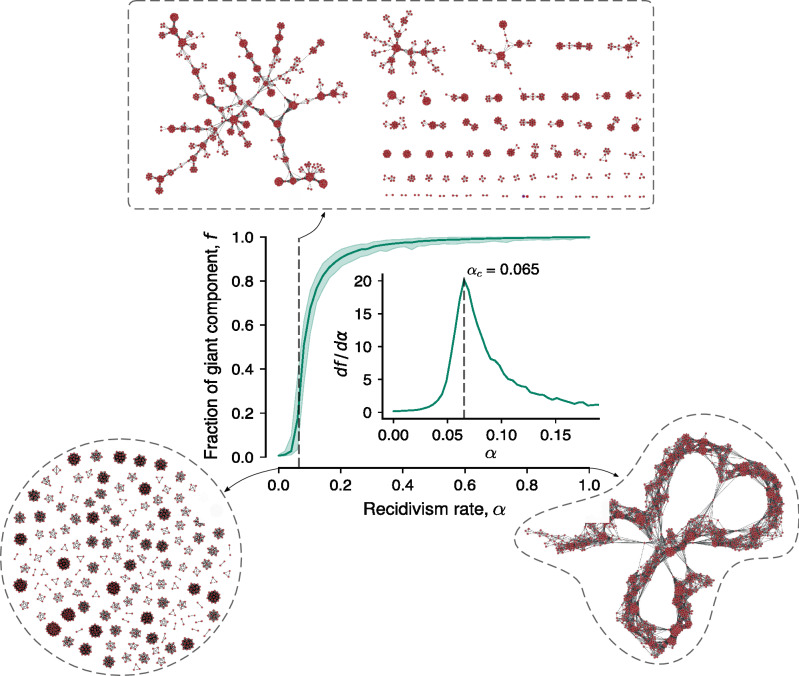
Figure 6.
Corruption networks seem to operate close to the critical recidivism rate of our model. The continuous curve in the main panel shows the average fraction of the giant component of simulated networks (f) as a function of the recidivism rate (), and the shaded region represents the minimum and maximum values of f estimated from one thousand model realizations for each . The inset in the main panel depicts the derivative of f with respect to , and the dashed vertical line (also shown in the main panel) indicates the critical recidivism rate of our model, a value that is not too far from the recidivism rates of the Spanish () and Brazilian () networks. The three visualizations surrounded by dashed paths represent typical simulated networks for , , and . We observe that (upper network visualization) generates networks visually similar to the empirical corruption networks.

